
|
Menu |


|
Menu |
Exploring Mars
| For more photos, simply follow Marsty. | |
| For more detailed information, simply follow Cosmo. |
The InSight mission begins

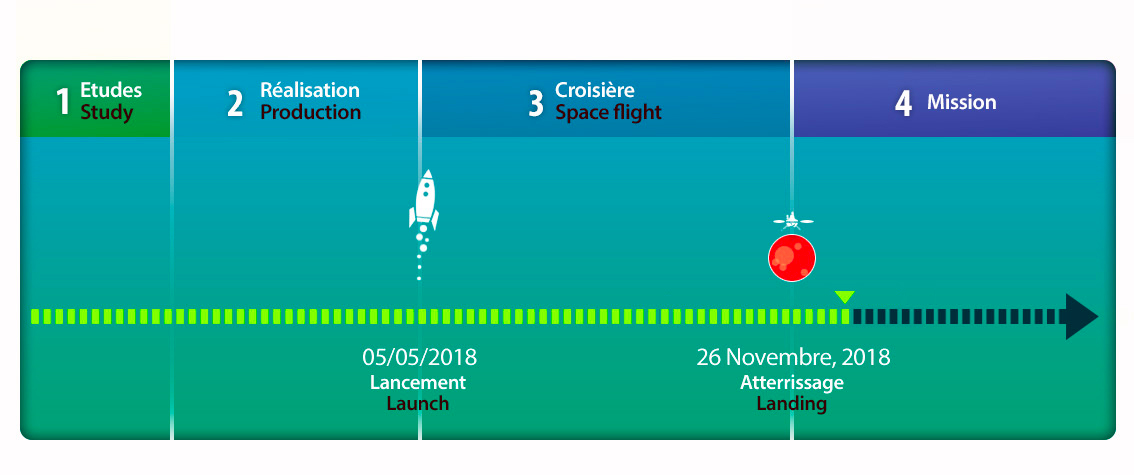
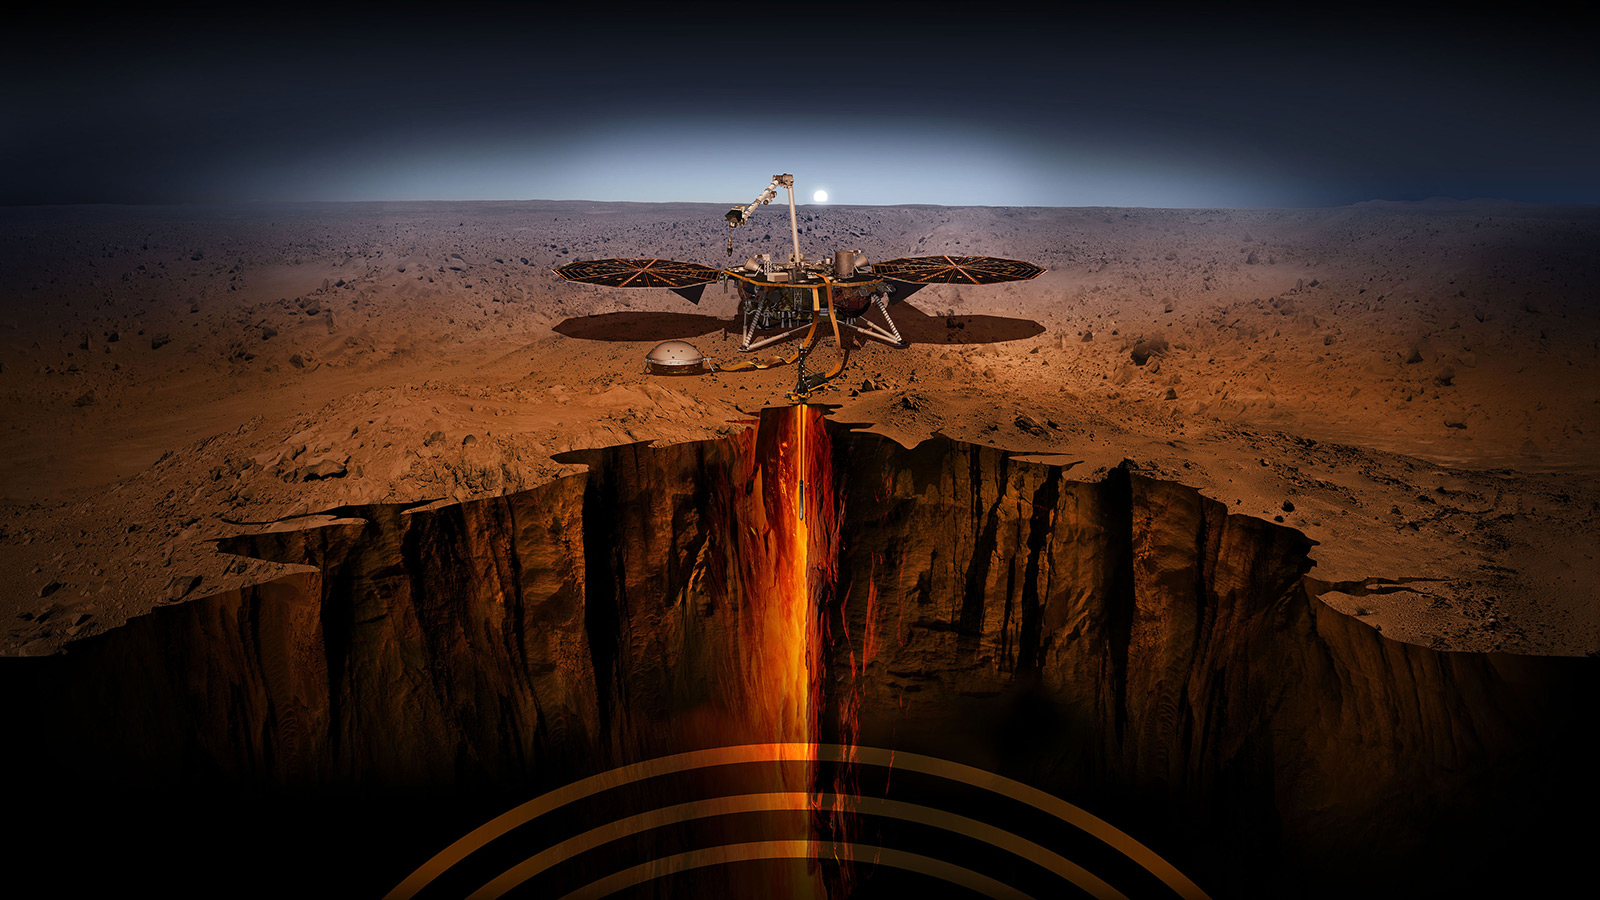
The InSight lander, which arrived at Mars on Monday November 26 2018, landed in a shallow crater in the Elysium Planitia region. It is inclined about 4 degrees from the horizontal and rests on a thin layer of sand.
We go to Mars,explaining the purpose of this mission by Domenico Giardini(© TEDxZurich)
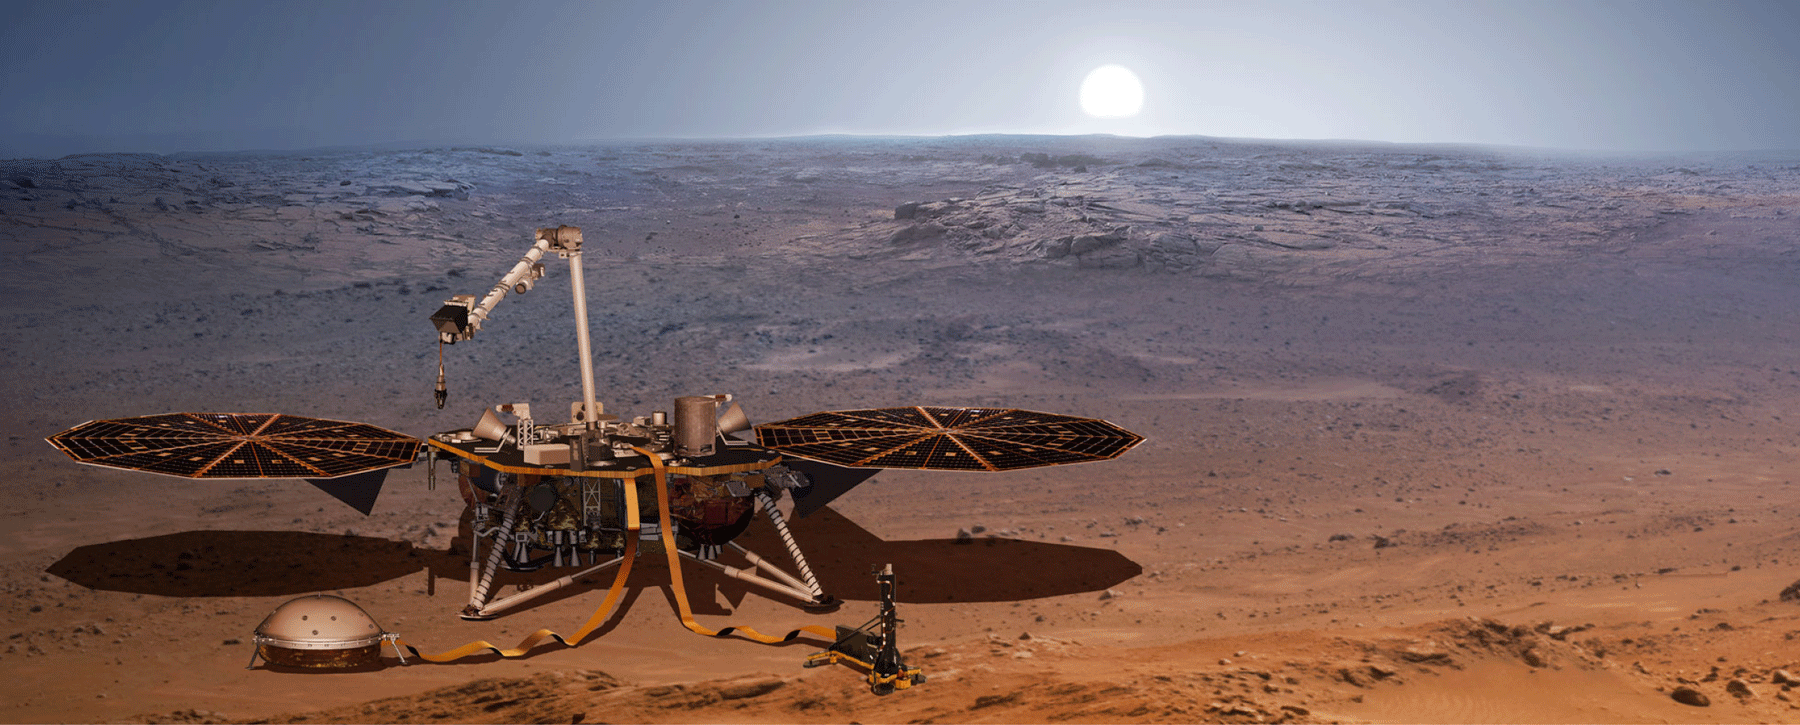
InSight is equipped with the SEIS seismometer, the HP3 heat probe, and a weather station which includes instruments to measure atmospheric pressure, temperature, wind direction and speed, the RISE radio experiment, the LaRRI retroreflector and the cameras.
Objective Mars: What are we looking for ? (© Université de Paris, IPGP et Team SEIS)
With this new adventure, let’s discover the measurements made and sent by InSight to our scientists with their interpretations to better understand the composition and functioning of the planet Mars.
We will see that seismology on Mars is very different from that on Earth. For more information on Earth seismology and physics, see Mission 7.
Forty-four years after the first heroic attempt by the Viking probes, SEIS was installed on martian soil in December 2018 and put into service in February 2019. Technically SEIS is working very well, but its recordings are disturbed by various sources of noise which interfere with weak seismic signals.
SEIS has been installed on Martian soil since December 2018, while HP3 was installed in February 2019. (© Nasa, JPL-Caltech, Cnes/IPGP, ETH Zürich)
The movement of the atmosphere is very turbulent during a martian daytime. Large variations in temperature are recorded ranging from -80 ° C to 0 ° C as well as large variations in wind speed.
At sunset, around 5 p.m.and until midnight the martian winds drop and the background noise level decreases around InSight. This is then the best time of day for SEIS to record seismic events.
Martian constraints (© Université de Paris, IPGP et Team SEIS)
A marsquake occurs when the Martian soil is subjected to an accumulation of stress so strong that there is fracturing of the rock structure.
The SEIS seismometer is the only seismometer positioned on Mars and is located near InSight. SEIS consists of 6 seismic sensors, 3 VBB pendulums in the vacuum chamber, and 3 small short-period sensors. It is therefore sensitive to a wide range of vibrations. SEIS was designed and adapted for the martian environment.

SEIS is protected by layers of insulating material, it is preparing here to be covered by a large shield, which will protect it from winds and temperature variations. (© IPGP/ Manchu/Bureau 21)
Structure of the Martian seismometer (© Université de Paris, IPGP et Team SEIS)
How to determine the epicentre of a marsquake on Mars?
Knowing the speed at which P and S waves travel through the martian crust and mantle, it is relatively easy to estimate the distance at which each event occurred by measuring the delay between the arrival of the P wave and the S wave (in the same way as one can estimate the distance to a thunderstorm by measuring the delay between the sight of lightning and hearing thunder).
For most events detected on Mars (including all high frequency events), this is all we can do, which allows us to plot the possible location of seismic events on a circle around the point of InSight landing.

Location of a marsquake using a single station. (© ETHZ)
For the best signals from low frequency events, it is possible to estimate the direction of wave motion.
The SEIS instrument measures the seismic movement of the ground in 3 directions at right angles to each other. Once the orientation of the SEIS sensor on the surface is determined (which is done using a solar compass on its housing), it is possible to convert these signals into vertical, north-south and east-west components. By plotting the 2 horizontal components with respect to each other, they indicate the movement of particles on the surface of the ground.
For the first arrival of the P wave at the seismic station, this movement of particles points towards the direction which the wave originates from.
Probable locations of the first marsquakes detected. (© Nasa InSight, Seis Team)
Quiz!
Validate your knowledge!
Martian quakes

This first result shows that the planet Mars is seismically active but with a seismicity very different from that of Earth.
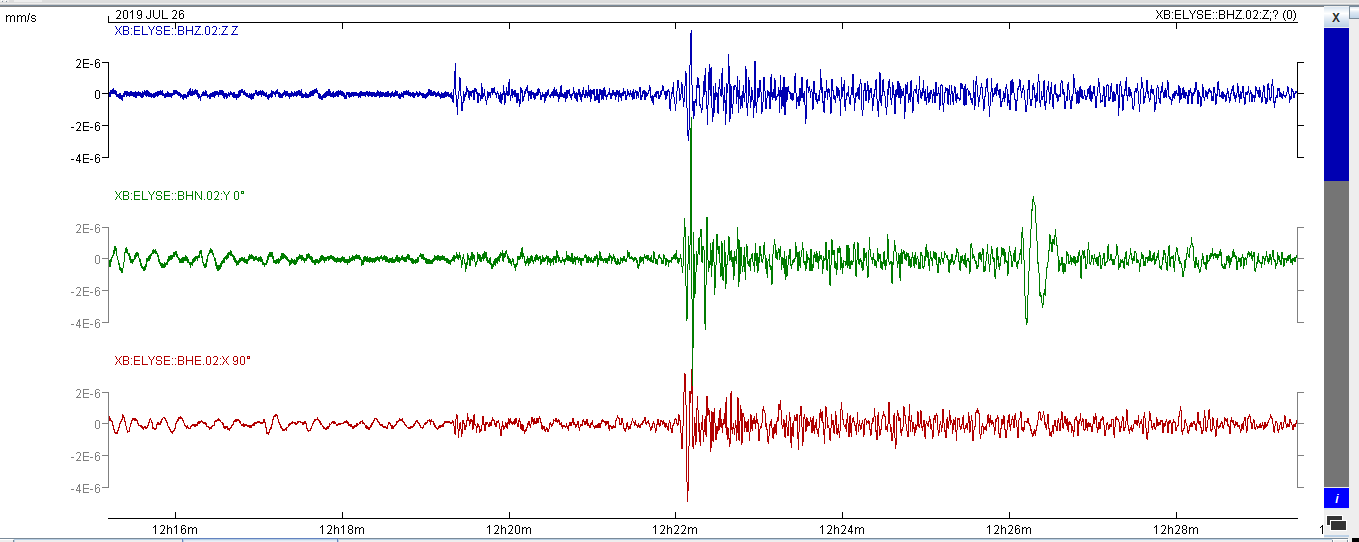
Let’s discover below the recording of the 1st marsquake recorded during the 128th martian day (sol 128), (i.e. April 6, 2019 on Earth).
The magnitude of this first marsquake is estimated to be between 2.1-2.5 and its origin is unknown.
Since this first marsquake, SEIS has detected more than 450 marsquakes, ten of which are magnitudes 3 and 4.
This video illustrates the 1st marsquake detected by InSight on April 6, 2019, on the 128th martian day of the mission. 3 distinct types of sounds are heard, all detected as ground vibrations by SEIS. First, the winds that sweep the landing site, then the first marsquake, and finally the movements of the robotic arm of InSight. (© Nasa, JPL-Caltech, Cnes / IPGP, Imperial College London)
..
1- low frequency marsquakes, with energy at about 1 Hz, that is to say 1 vibration per second.
2- high frequency marsquakes, with energy higher than 1 Hz, that is to say several vibrations per second.
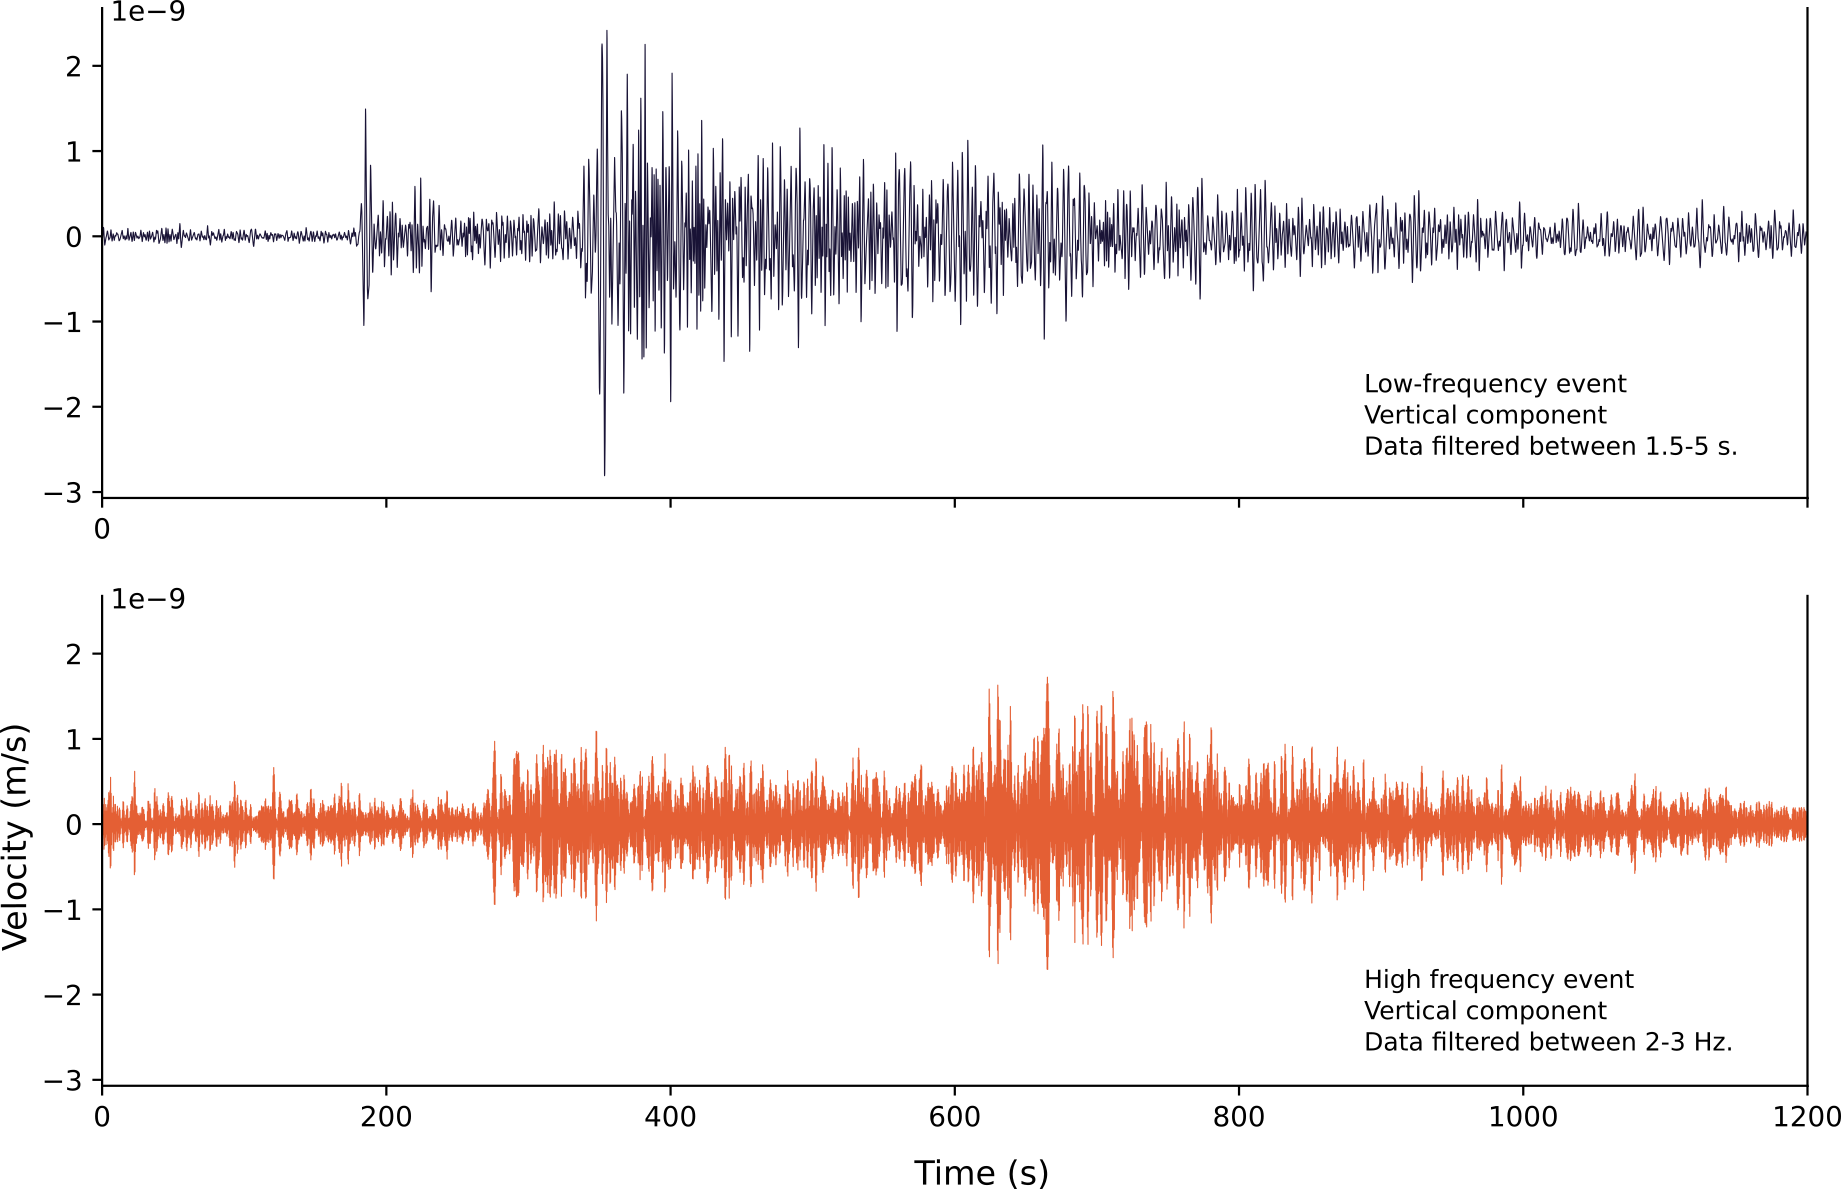
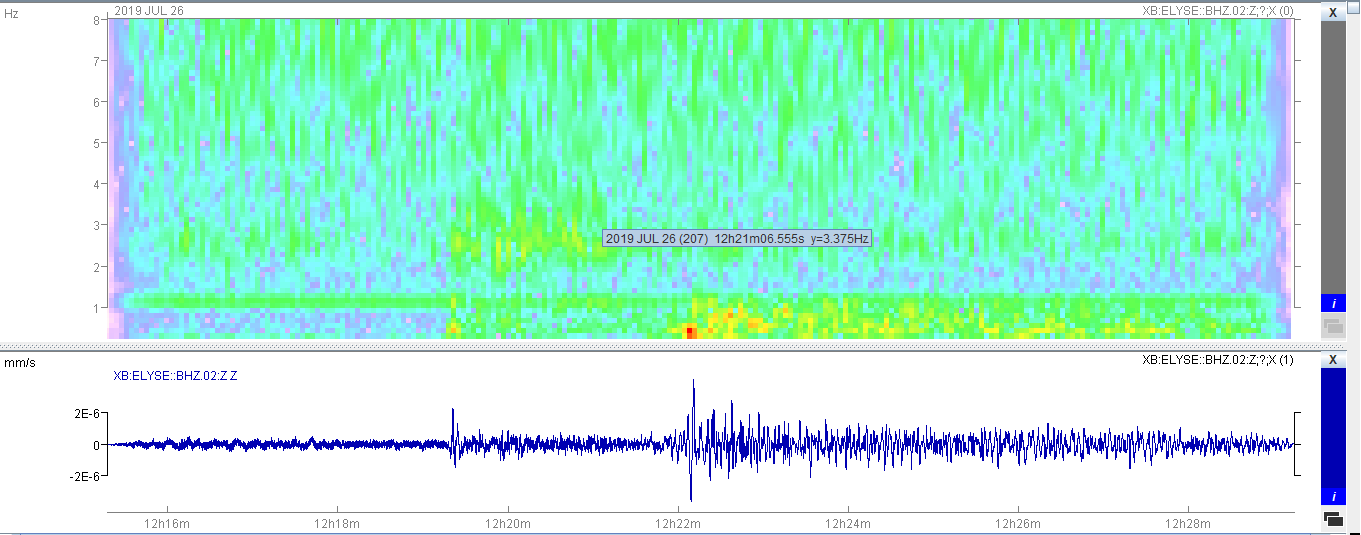
Here are 2 events, a high and a low frequency. The high frequency event lacks energy below 2 Hz (or 0.5 seconds period), while the energy contained in low frequency events is concentrated at frequencies below 1 Hz.(© Nasa InSight, Seis Team Giardini et al.(2020) )
All the low frequency events are certainly marsquakes, however for the high frequency events, which are the most numerous, seismologists are cautious and think that they are probably not all marsquakes. They believe that some of these events are due to landslides, rock falls, or weather phenomena. Records of high frequency marsquakes show that the focus of these marsquakes is located in the martian crust and that the waves emitted remain trapped in the crust.
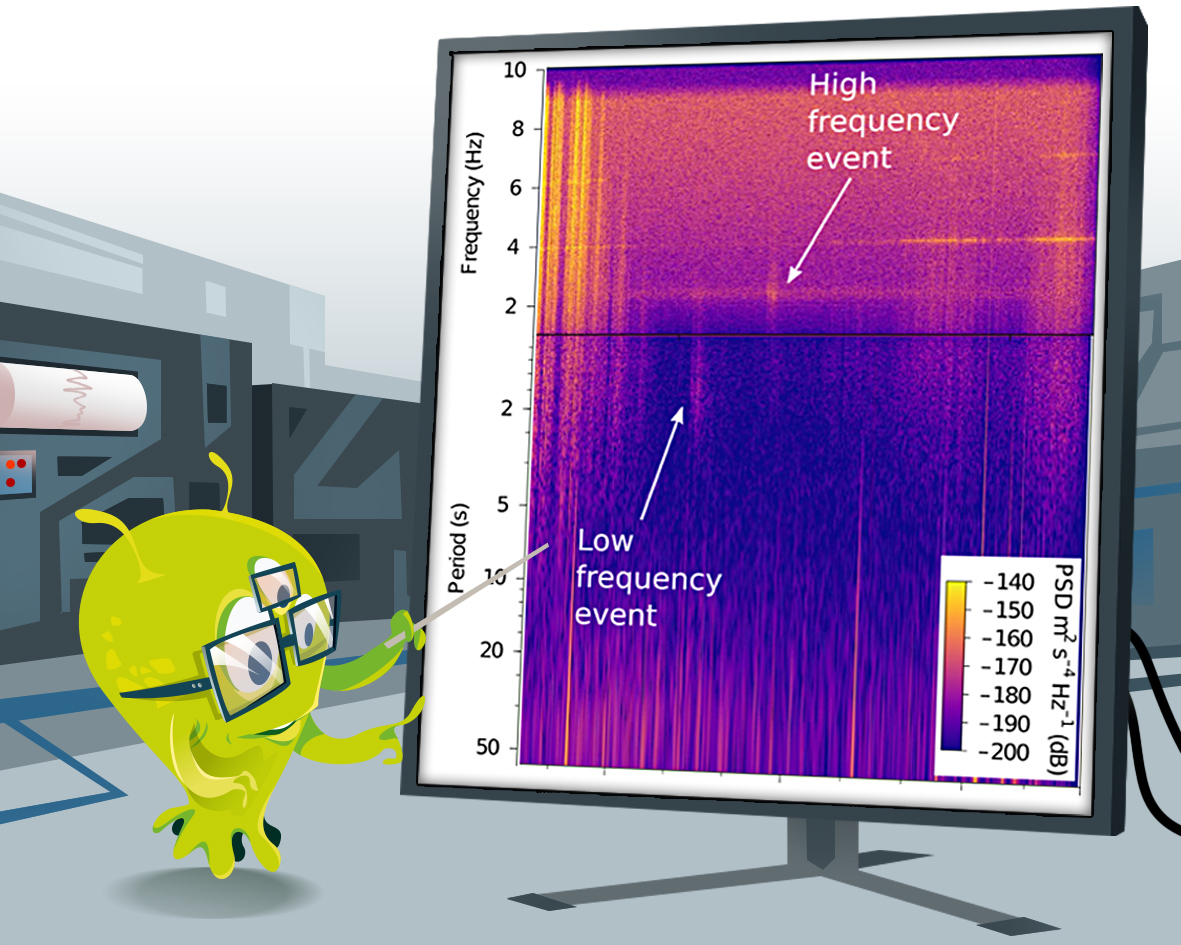
A high and low frequency event shown on a spectrogram plot. In these plots the X axis is time (across an 8 hour timespan) and the Y axis is frequency (0-10 Hz) , the amount of energy in each frequency band is indicated by the colour of the plot, hotter colours indicate more energy at this frequency.(© Nasa InSight, Seis Team Giardini et al.(2020))
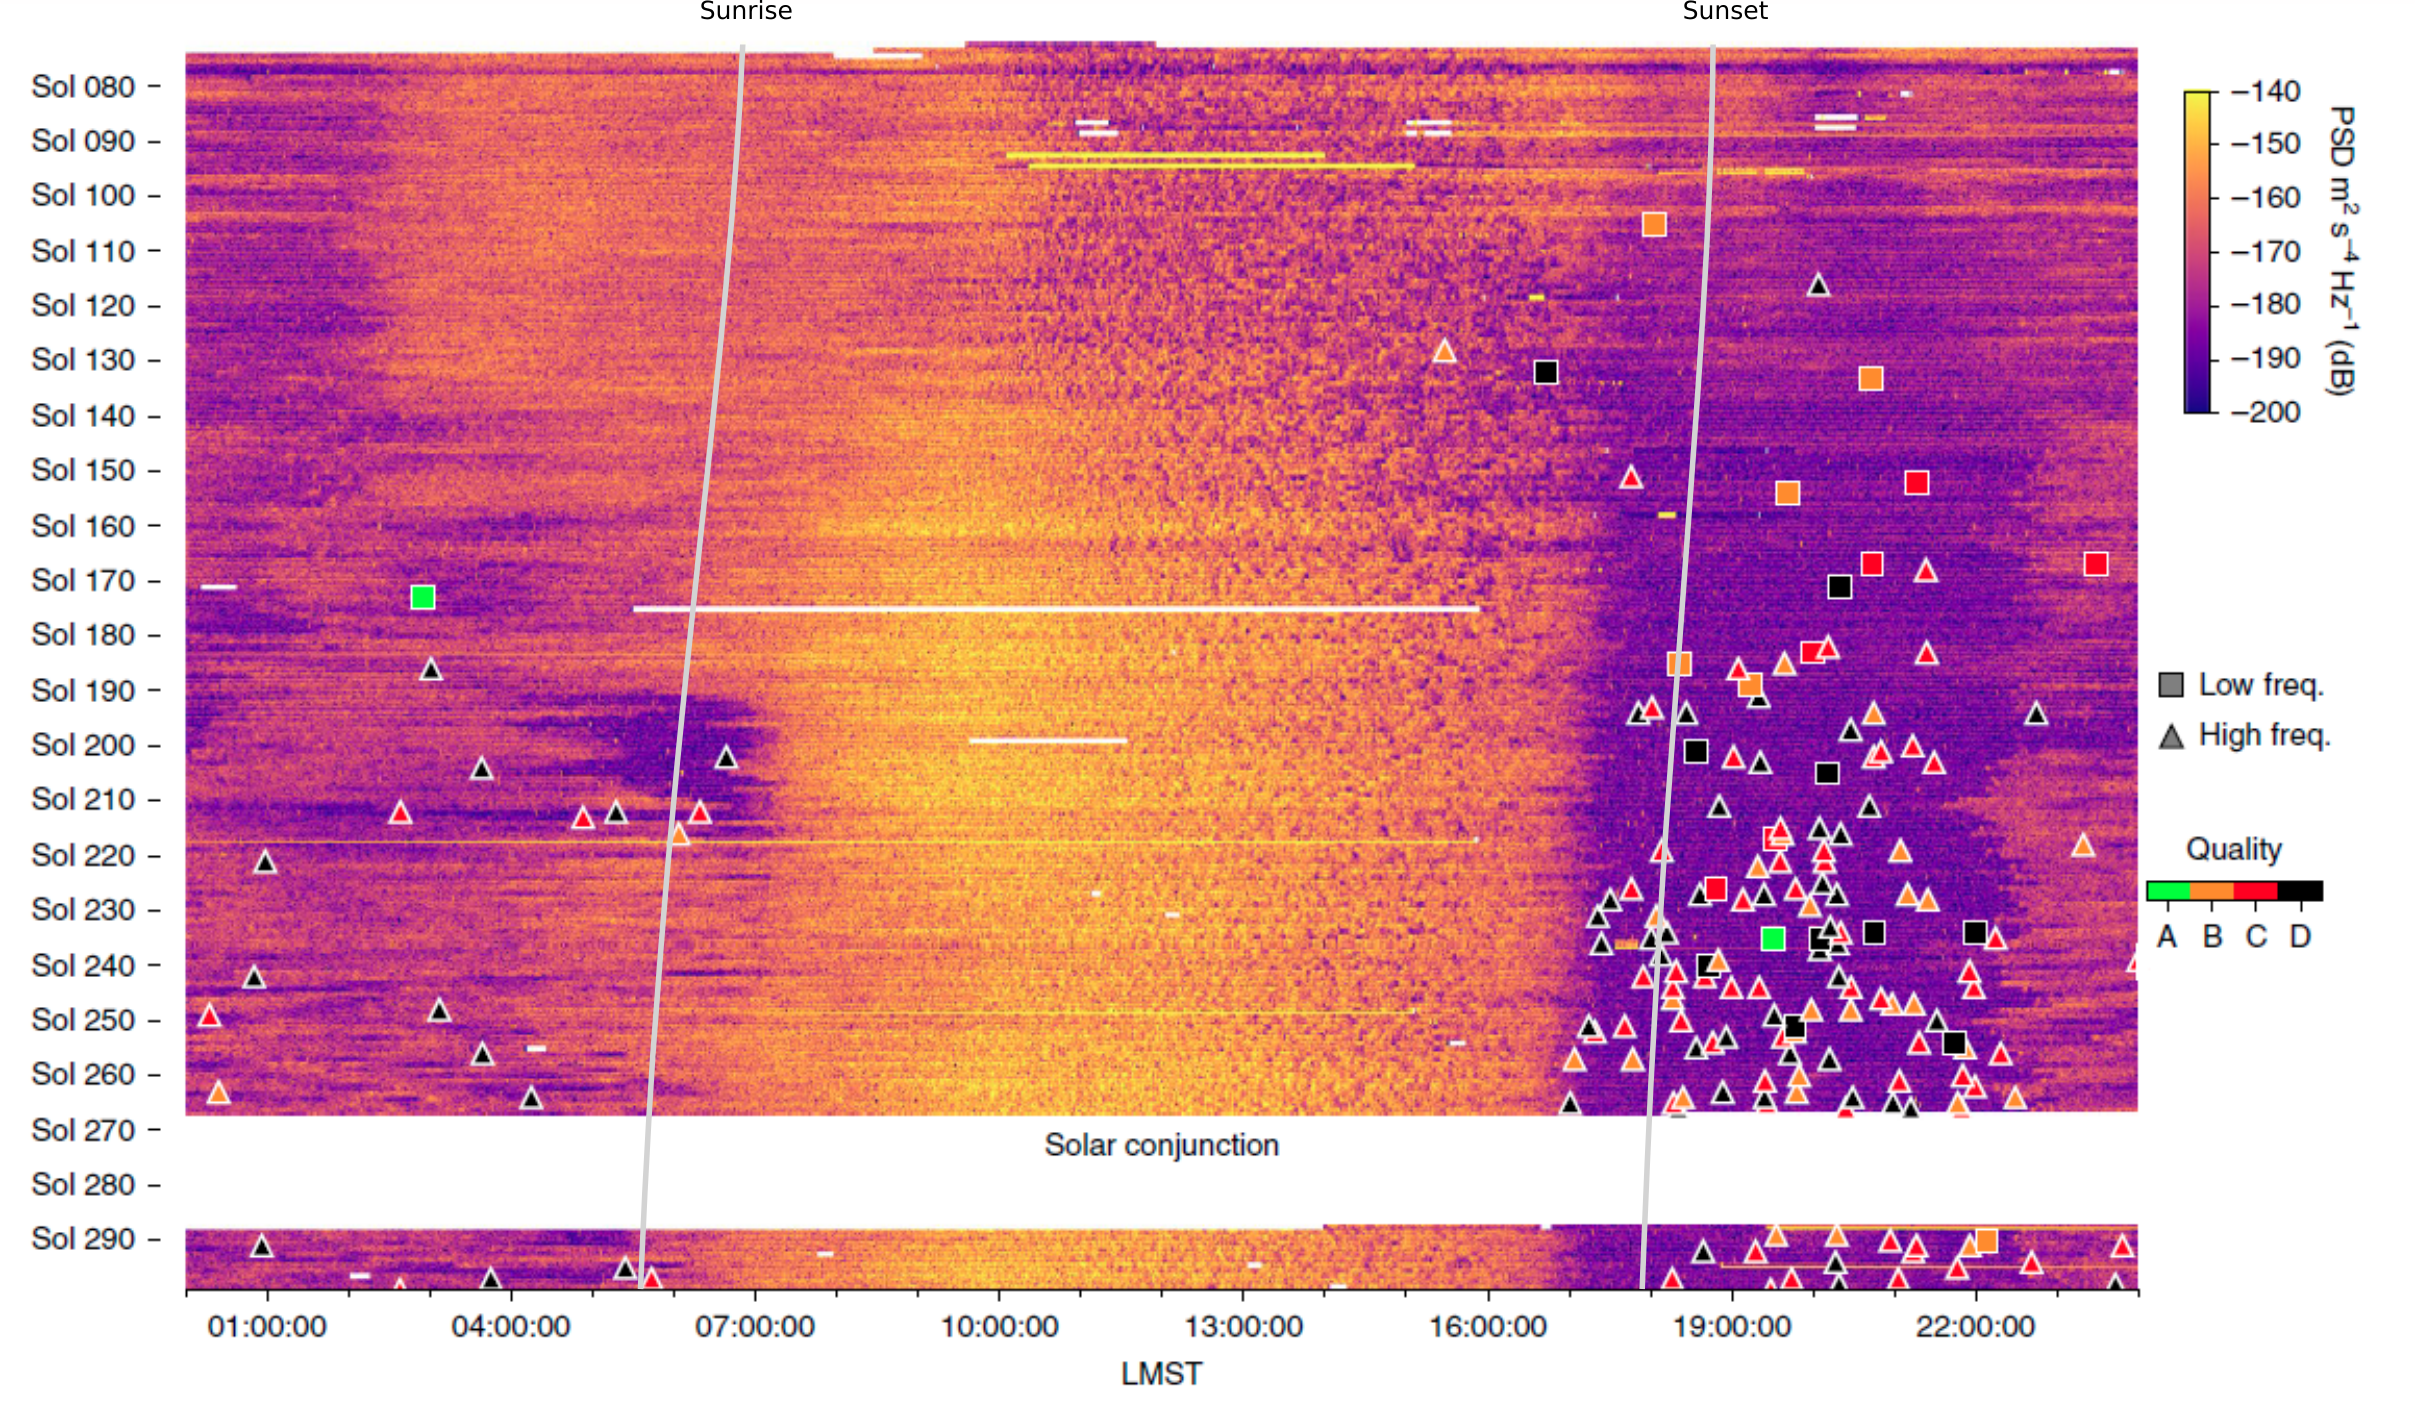
Summary spectrogram indicating the origin of marsquakes detected from sol 80 to sol 290 (y axis), according to the time of day on Mars (x axis). The image is modified from Giardini et al. (2020) with the sunrise and sunset times added(© Nasa InSight, Seis Team Giardini, D., Lognonné, P., Banerdt, W.B. et al. The seismicity of Mars. Nat. Geosci. 13, 205–212 (2020). https://doi.org/10.1038/s41561-020-0539-8)
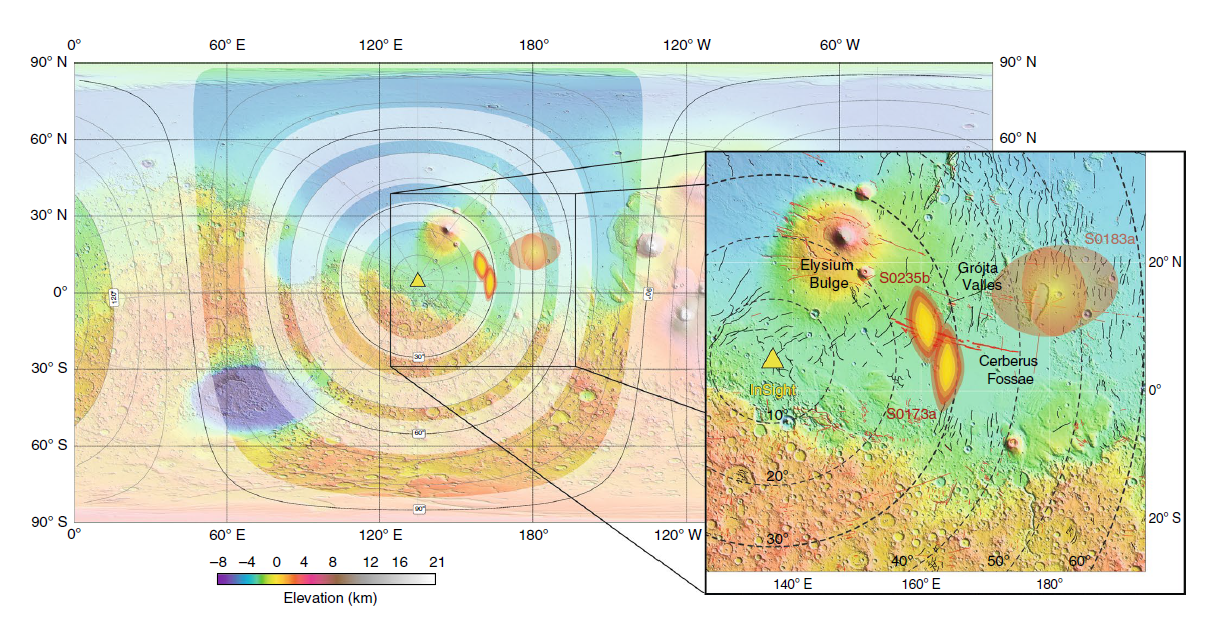
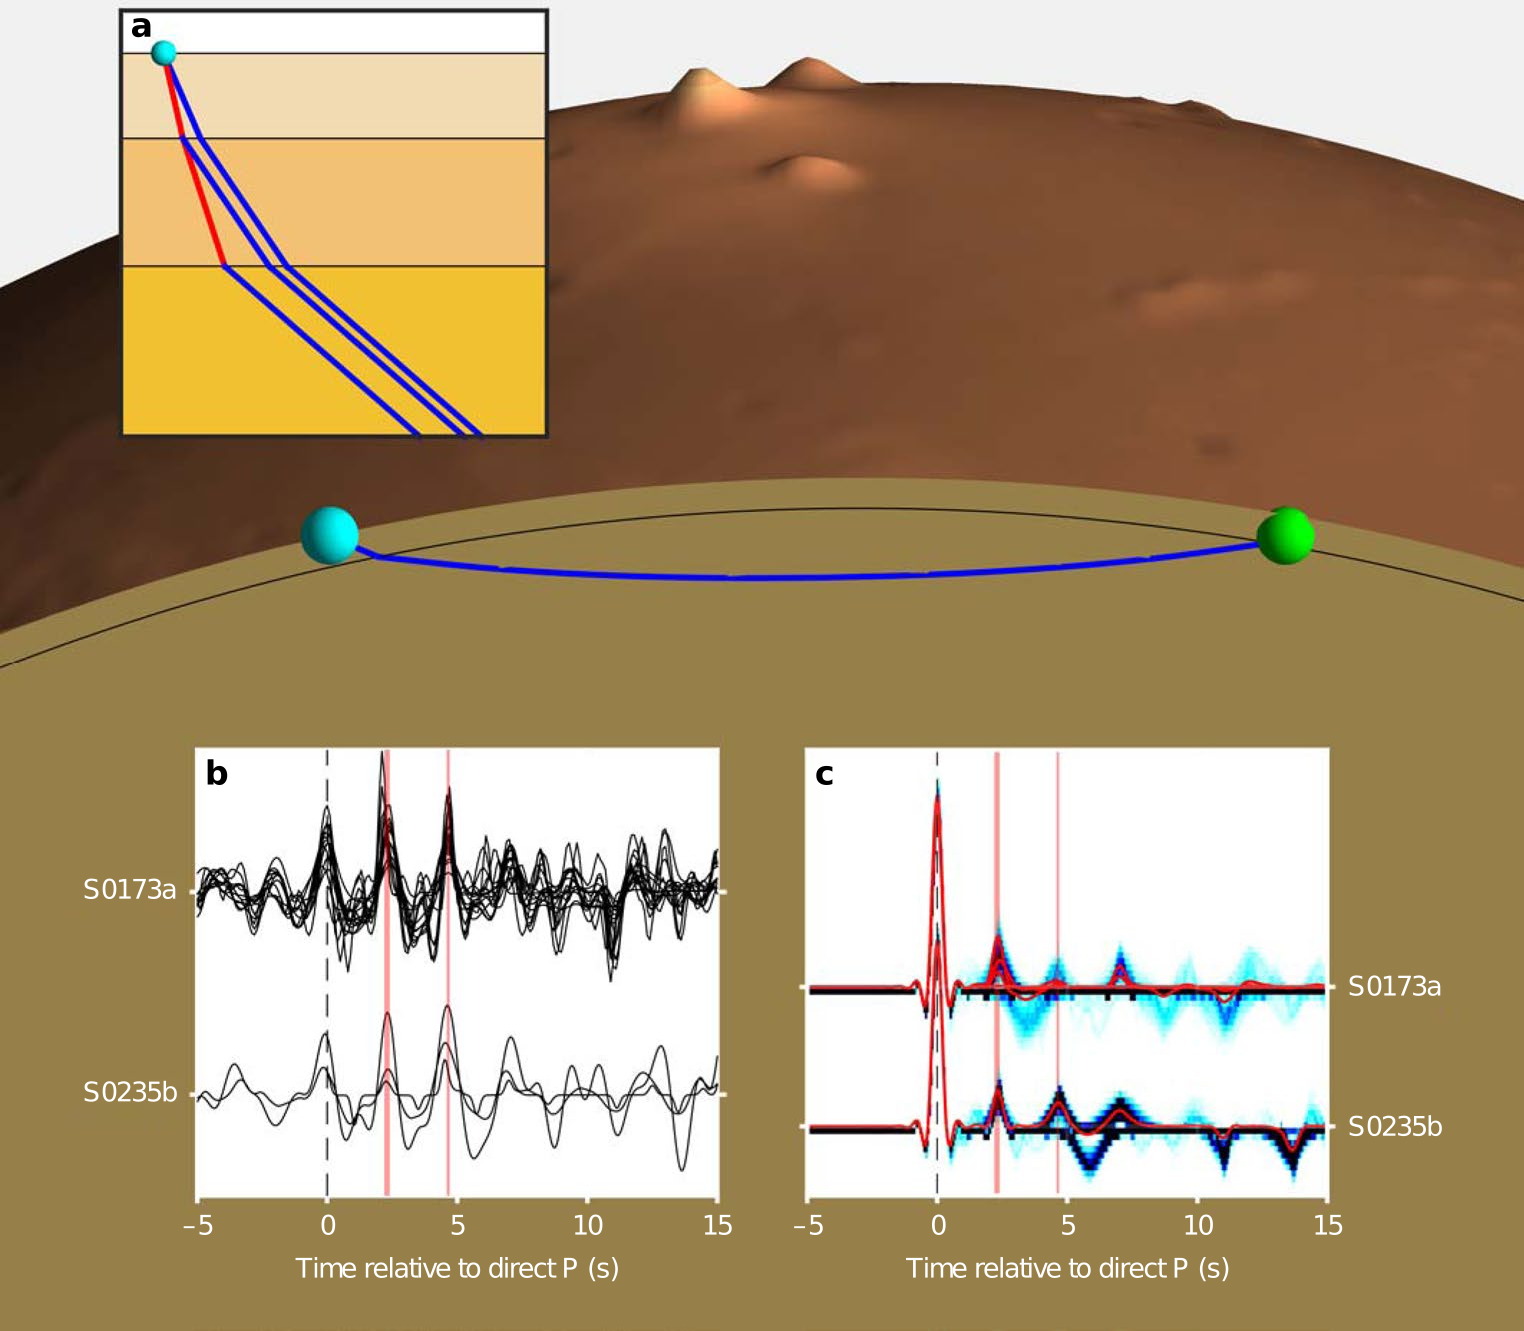
The study of 24 low frequency marsquakes recorded with magnitudes of 3 or 4 is very interesting. Two of these marsquakes detected on sol 173 and sol 235 show that their epicentres were located some 1,600 kilometres from InSight.
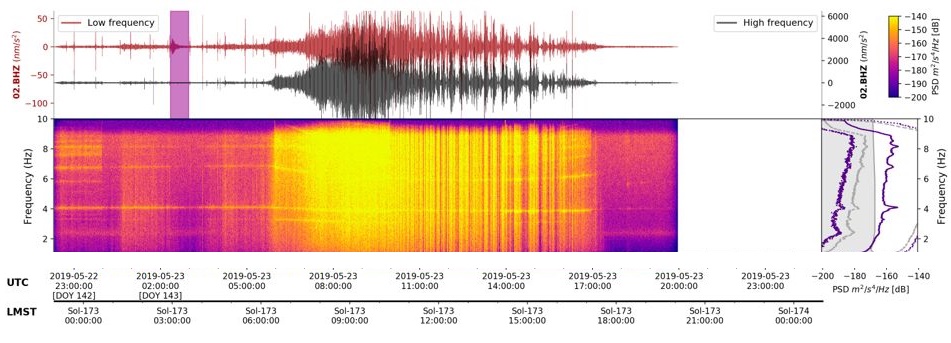
Recording of seismic activity during sol 173. These seismograms show the seismic data, the y axis represents the amplitude and the x axis represents time. The data is also presented in the form of spectrograms and in this case, the x-axis represents time while the y-axis represents frequency. The colors representing the amount of energy for each frequency band, the hottest colors representing a higher energy.(© Nasa InSight, Seis Team)
Listening to the heartbeat of Mars (© Université de Paris, IPGP et Team SEIS)
1- This particularly large number of marsquakes is comparable to that observed in the intra-plate terrestrial zones, that is to say in the zones which are not directly subjected to plate tectonics. Unlike Earth and its multiple tectonic plates, the various observations made over time show that the planet Mars seems to consist of a single plate.
2- This data suggests that Mars has an activity 2 to 3 times weaker than the Earth’s intra-plate seismic activity, that is to say to terrestrial areas not affected by plate tectonics or associated with hot spots and 10 to 20 times that of the Moon.
3- Where are the epicentres of the first marsquakes recorded by SEIS located?
The seismic waves of these 2 events arrived from a region called Cerberus Fossae.
It is a huge fault system located east of the Elysium plain, where InSight has landed. This fault system was probably formed during the establishment of the volcanoes forming Elysium Mons. As a former site of significant volcanic, river and wind activity (which the most recent evidence dates from 10 to 2 million years ago), the Cerberus fracture zone seems to have accumulated a lot of stresses.
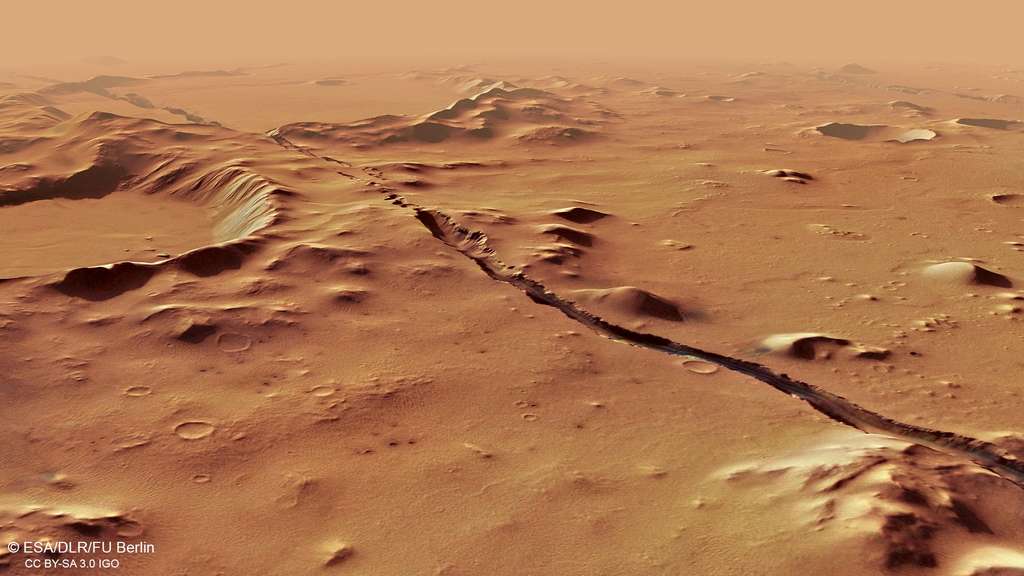
Perspective view of a fault in the Cerberus Fossae region photographed by the Mars Express probe (© ESA, DLR, FU Berlin, CC by-sa 3.0 IGO )
Combining these seismic results with images provided by satellites orbiting Mars, everything indicates that the Cerberus Fossae faults are still active, and continue to move.
4- In general, scientists believe that marsquakes come from the slow cooling of the planet which causes the surface to contract causing the development of fractures. These marsquakes can also have as their sources the impacts of small meteorites or the movements of magma coming from the crust or the martian mantle.
What emerges from these first seismic studies:
1- The majority of marquakes are of low magnitude, the seismic waves emitted are of high frequency and remain trapped in the martian crust with a long signal duration of 10 to 20 minutes due to the propagation properties of the martian crust. Marquakes with a magnitude greater than or equal to 4, are very rare, their waves propagate in the martian mantle.
The seismicity of Mars is active and very different from that of the Earth and that of the Moon. 2- The data show that the upper crust of Mars could have a thickness of 8 to 11 km and would be made up of very altered or fractured volcanic materials which “could suggest a prolonged contact with water”. This alteration is not only the result of meteorite impacts, but also from the past activity on Mars, including from several thousand years ago when there was circulation of water in the crust and on the surface.
3- Under this altered martian crust is a consolidated crust. It is a more homogeneous and coherent layer which could continue down to the beginning of the mantle. As the martian crust begins to reveal its secrets, the structure of the martian mantle is being analyzed and should be clarified in the coming months.
Mars is seismically active. (© Nasa, JPL-Caltech, ETH Zürich, Van Driel)
On Mars, the majority of events detected so far are of relatively deep origin and have not created any surface waves.
However, seismologists expect to see surface waves when a shallow marsquake or a large meteorite impact occurs.
The early results from analysing seismic data has allowed scientists to make some deductions about the shallow and crustal structure of Mars.
Characterization of the martian surface
Careful analysis of the seismic signal generated by the tapping of the mole from the thermal probe and of the seismic disturbances generated by the atmospheric pressure fluctuations caused by the passage of dust vortices enabled scientists to characterize the dusty subsoil of Elysium Planitia - InSight’s landing site.
This subsurface is made up of two distinct layers:
1- a surface layer formed of materials crushed by innumerable impacts for billions of years. This layer a few metres thick is called the regolith.
This layer seems to hinder the penetration of the HP3 probe. During its hammering sessions, HP3 vibrates the basement, behaving as an active seismic source. Thanks to this, scientists are able to estimate the speed of propagation of seismic P-waves in the first metre of the martian surface, making it possible to deduce physical characteristics specific to the regolith.
The thickness of the regolith layer is less than 2 metres with a slow seismic speed of the order of 90-140 m/sec
2- This layer rests on a harder bedrock characterized by a seismic speed ranging from 500-1200 m/sec varying from ten to one hundred metres deep.
This subsurface was probed thanks to the deformations induced by the passing by of dust devils. They cause very clear pressure drops on the data from the ultra-sensitive pressure sensor of the InSight APSS weather station and are also recorded by SEIS.
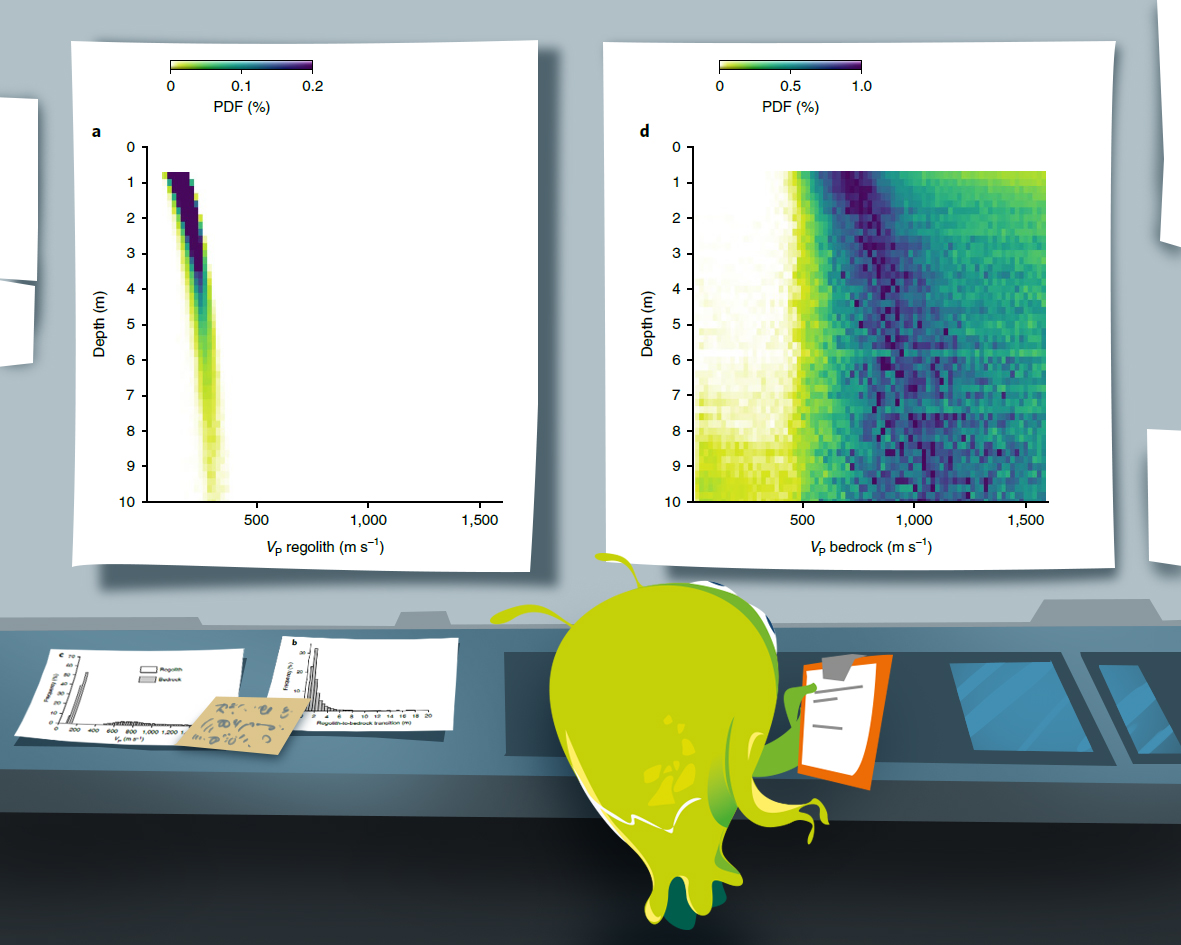
Thickness of the regolith and the seismic velocity in the underlying bedrock (© Nasa InSight, Seis Team)
Martian crustal structure
Careful analysis of the seismic signals from the largest marsquakes shows the presence of converted waves. These occur when a seismic wave crosses a boundary between layers with significantly different seismic velocities, at such boundaries P waves can be converted to S waves and S waves can be converted to P waves.
Seismic waves can be converted from P to S when they cross a boundary with a big change in seismic velocity (© Nasa InSight, Seis Team Lognonné et al.(2020) )
Careful analysis of these converted waves from the first few located marsquakes indicates that there is a boundary layer accompanied by a change in seismic velocity at a depth of 8-11km within the martian crust.
With only a few seismic events large enough to be accurately located and no recordings of surface waves it is difficult to make very many deductions about the nature or structure of the Martian mantle.
One technique that has proved possible is to look at the rate at which seismic signals have been attenuated as they pass through the mantle.
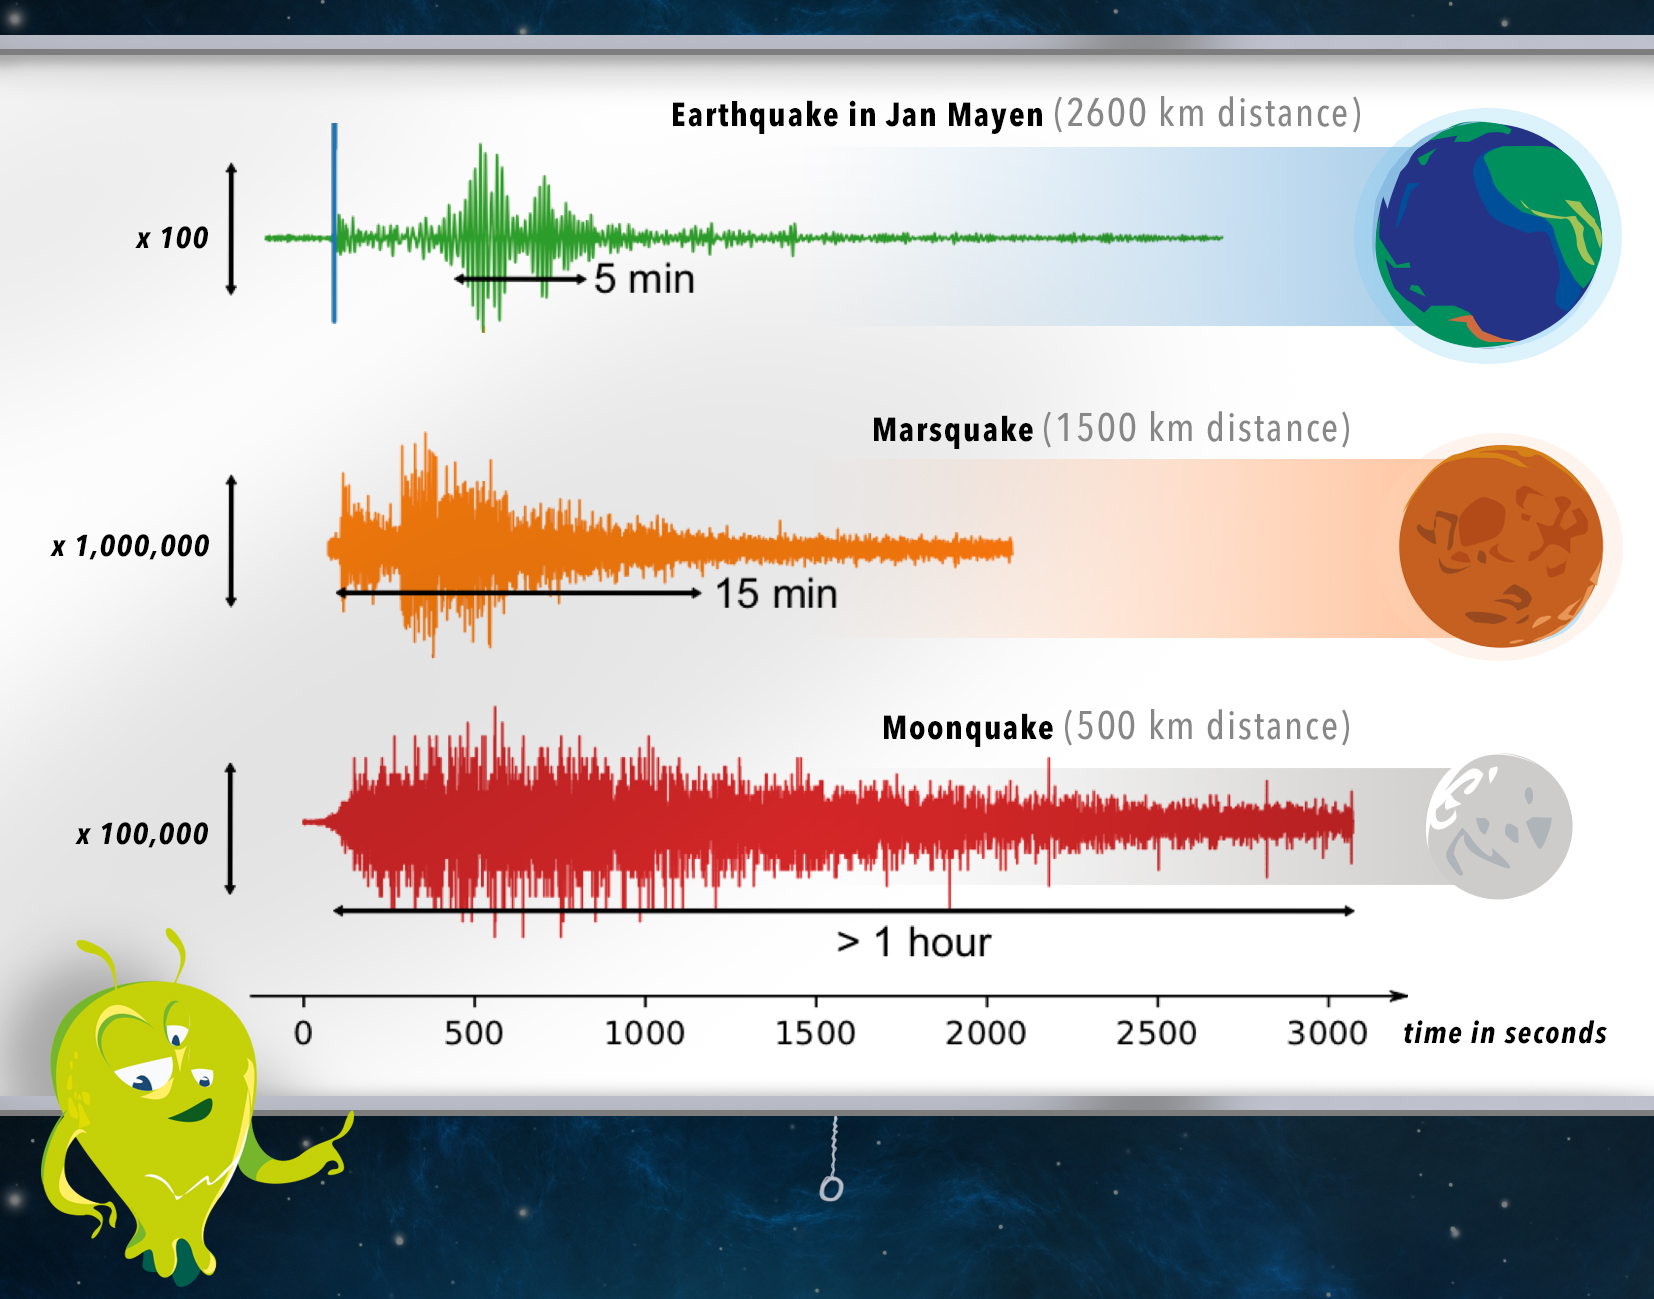
Comparison of seismic signals on Mars, the Moon and Earth. (© J.Clinton, ETHZ)
The seismic signals from Mars are more like moonquakes than earthquakes, with a long reverberation after the initial signal.
Earthquake signals from events at similar distances tend to be fairly short signals. Much of the wave energy is lost quickly. The loss of energy from seismic waves is due to the movement of liquid water in the tiny pores of rocks.
Moon and Mars quake signals last much longer than those collected on Earth, indicating that the seismic waves have bounced around without losing as much energy. This result implies that the material is very dry and fractured.
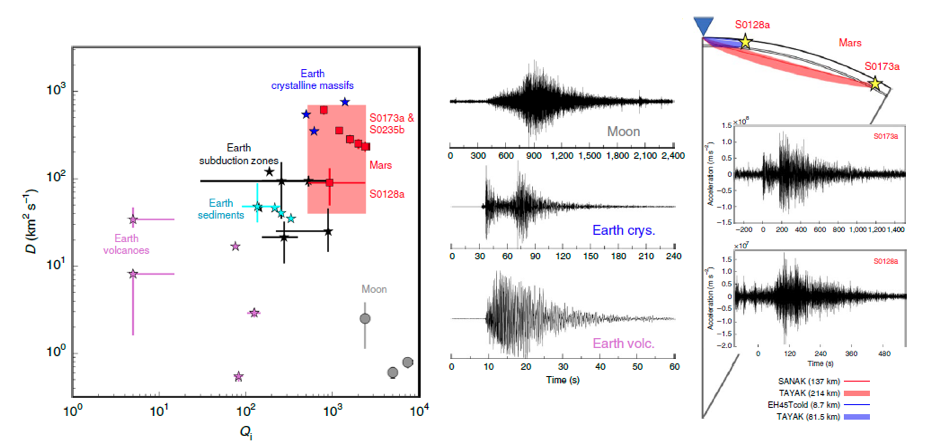
Speed at which seismic waves are attenuated and dispersed on Mars and comparison with the Moon and Earth. (© Nasa InSight, Seis Team from Lognonné, P., Banerdt, W.B., Pike, W.T. et al. Constraints on the shallow elastic and anelastic structure of Mars from InSight seismic data. Nat. Geosci. 13, 213–220 (2020). https://doi.org/10.1038/s41561-020-0536-y)
This attenuation rate is a good indication of the nature of the rocks that the waves have passed through.
Because we still do not have a very good idea what the precise velocity structure of the mantle is on Mars we can only make an estimate of the likely range of attenuation values.
Initial results indicate that these are consistent with those found on Earth in crystalline massif regions.
In order to gain more information about the nature of the martian core we need to wait for more data. Analysis of the rotational “wobble” of Mars from the high resolution RISE instrument will be important but will require a very long period of data collecton.
Seismic signals from much larger events that have occurred on the other side of the planet and create seismic waves that pass through the core will allow a more detailed analysis of core material.

Meteorite impacts. (© Arteclick)
Meteorites are still hitting the surface of Mars. The repeated passages of satellites in orbit allow us to see the new impact craters as they are formed.
The scientific team hopes to be able to detect the seismic signal of one of these impacts each year. Meteorite impacts will then constitute a very important calibration point for scientists, because they will make it possible to precisely locate one of the seismic signals and to calibrate the velocity models they use.
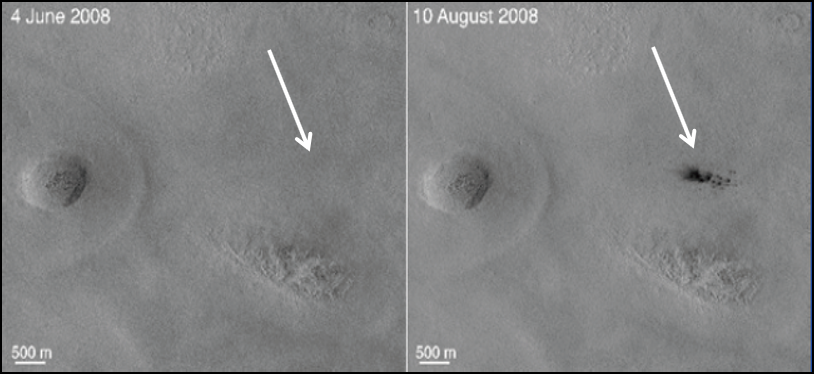
A new meteorite impact crater detected from the orbit of a satellite. (© NASA)
Quiz!
Validate your knowledge!
Heatflow, Meteorology and Magnetic Fields

Measuring the rate that heat energy flows out from the interior of Mars will provide scientists with important information about the nature of its interior and the likely thermal history of its formation.
Heat probe 5 m deep (© NASA)
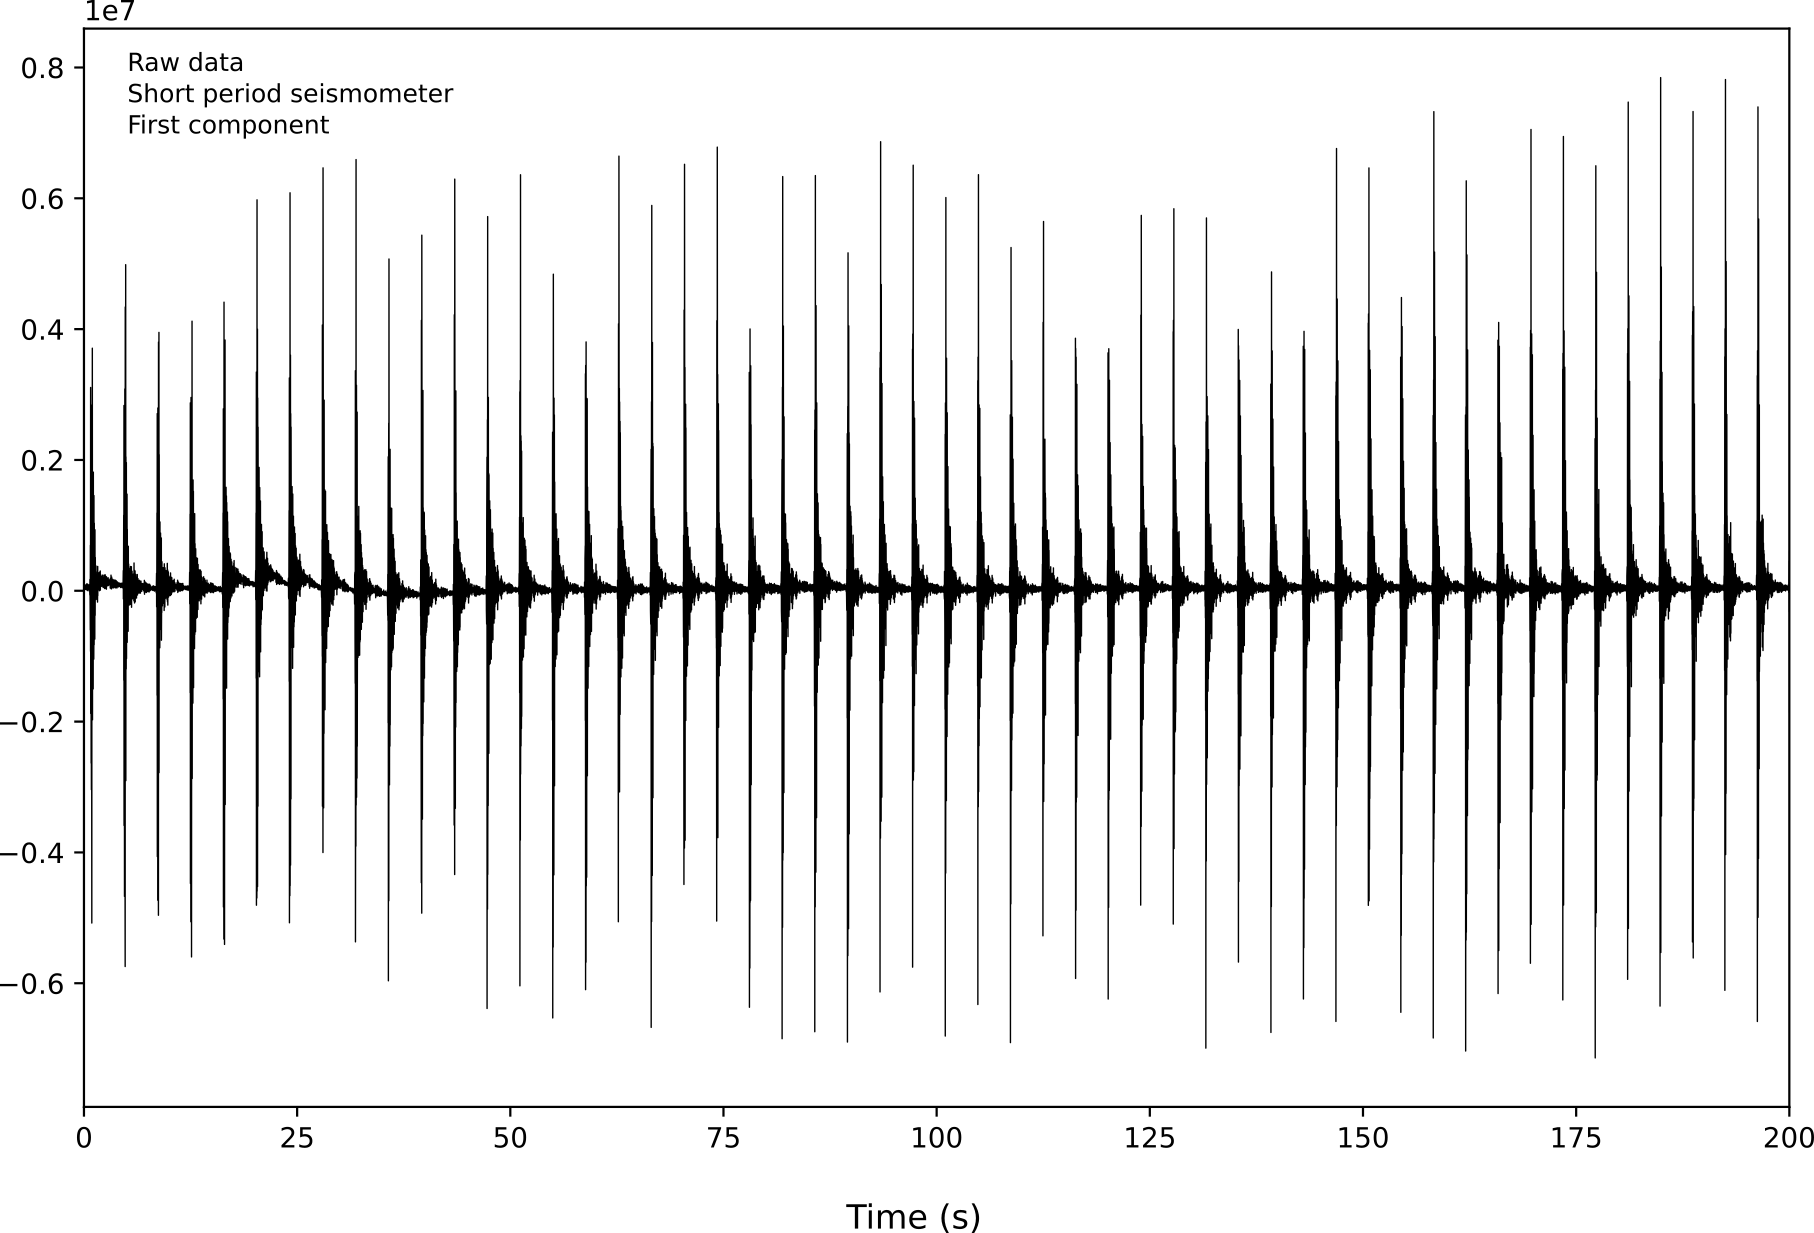
The heatflow instrument HP3 is designed to burrow itelf up to 5m below the surface and once there to measure the temperature very accurately at points down this hole.
For this, the HP3 heat probe is designed to bury itself up to 5 metres below the surface and, once there, to measure the temperature very precisely at points down to the bottom of this hole.
The HP3 probe consists of a small spring-loaded hammer called a taupe whose mission is to drive the probe to a depth of 5 m. The path taken by this instrument is strewn with pebbles that bounce, stop and block the instrument. For this reason a pause in the drilling was decided and after a few weeks a solution was found by the scientists which consists of using the end of the shovel of the InSight robotic arm to gently tap the instrument and thus help the mole to progress in the subsoil. This solution is currently a success as HP3 is slowly progressing through the ground.
Listen to the noise of the progress of HP3 in the soil here:
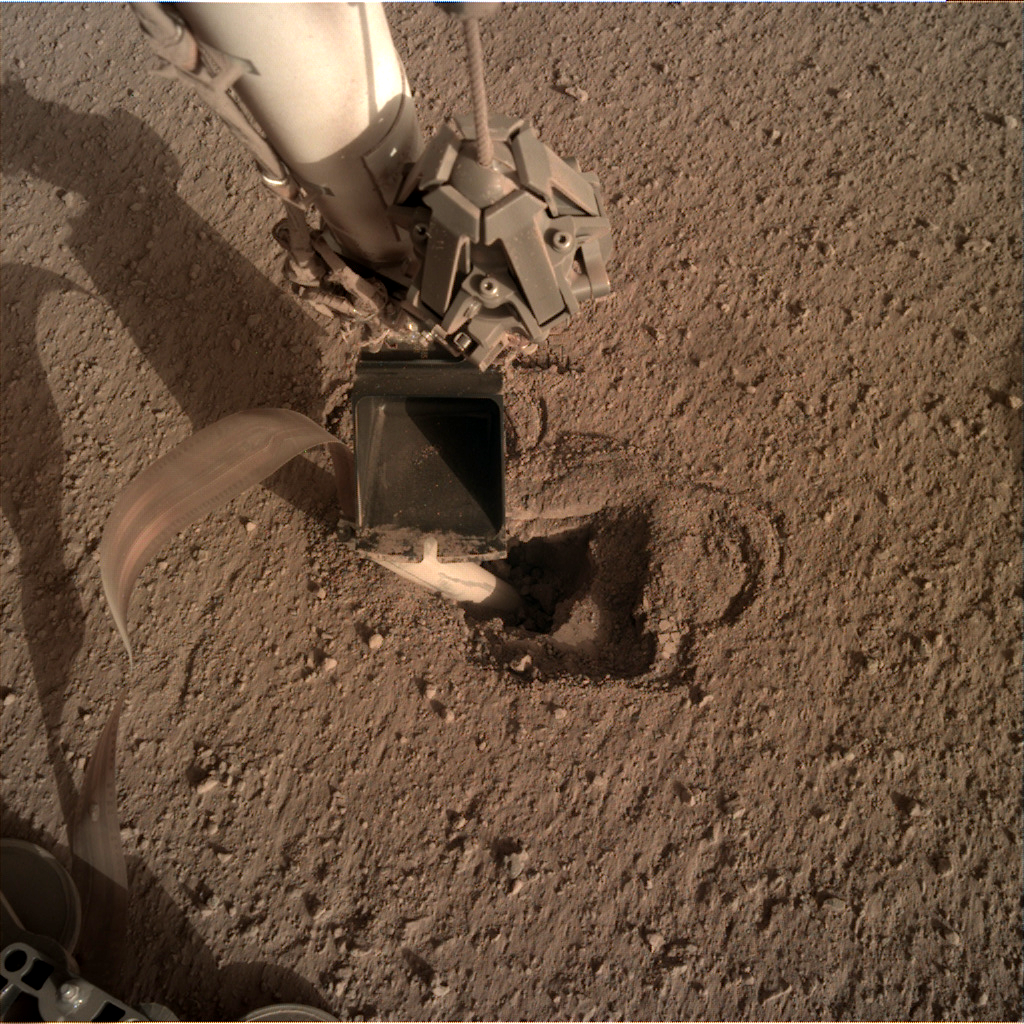
InSight's robotic arm shovel to drive the HP3 heat probe into the Martian soil(© NASA)
NASA posted a GIF on Twitter showing that the HP3 is advancing a few inches. It is nowhere near the target depth of 10 to 16 feet, but any progress is a good thing after months of failure. The arm will only help the probe until it disappears below the surface, but the more compact soil at this depth could allow the digging mechanism of the probe to work as expected.
The tapping of the heatprobe mole is detected by the SEIS instrument (© Nasa)
The tapping mechanism of the mole produced clear seismic signals that were detected by the SEIS instruments, careful analysis of these sesmic signals helps to determine the shallow structure of the basin that the InSight lander is sitting in (down a few metres).
Much information on the martian atmosphere has already been obtained during previous missions and by satellites in orbit around Mars. However, InSight’s meteorological instruments provide an unprecedented level of detail for obtaining crucial measurements on the martian surface.

Information on the martian atmosphere. (© Arteclick)
These measurements allow satellite data to be calibrated, detailed studies of atmospheric pressure and temperature as well as measurements of wind speed and direction to be made.
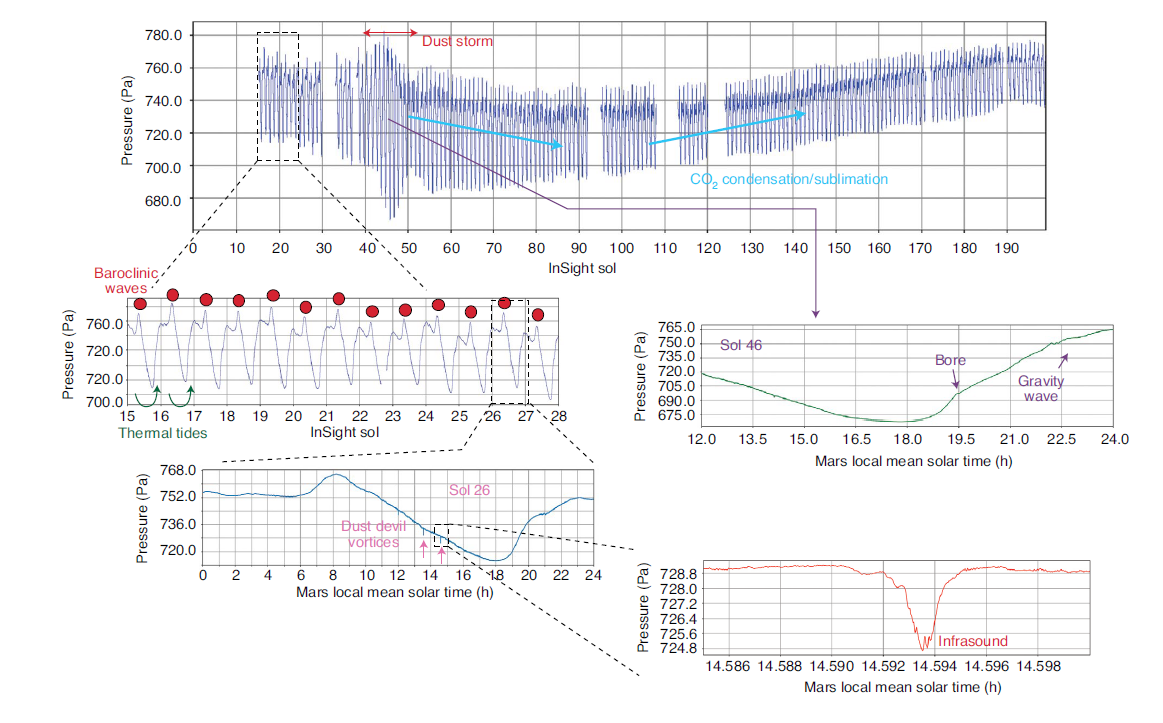
Overview of meteorological pressure data for the first 200 sols. (© InSight Science team Banfield, D., Spiga, A., Newman, C. et al. The atmosphere of Mars as observed by InSight. Nat. Geosci. 13, 190–198 (2020) https://doi.org /10.1038/s41561-020-0534-0).
The meteorological data show interesting variations at a whole variety of scales.
1-On the longest seasonal scale it shows the variation in atmospheric pressure changes as CO2 in the atmosphere freezes and sublimates in an annual cycle.
2-Daily cycles are very pronounced with large day-night pressure and temperature fluctuations.
3-Very short time events caused by dust-devil like vortices and larger scale atmospheric motions (called bores and gravity waves) are also seen.
4-Daily variations in the atmosphere show up on all instruments, pressure, temperature, windspeed and wind direction.
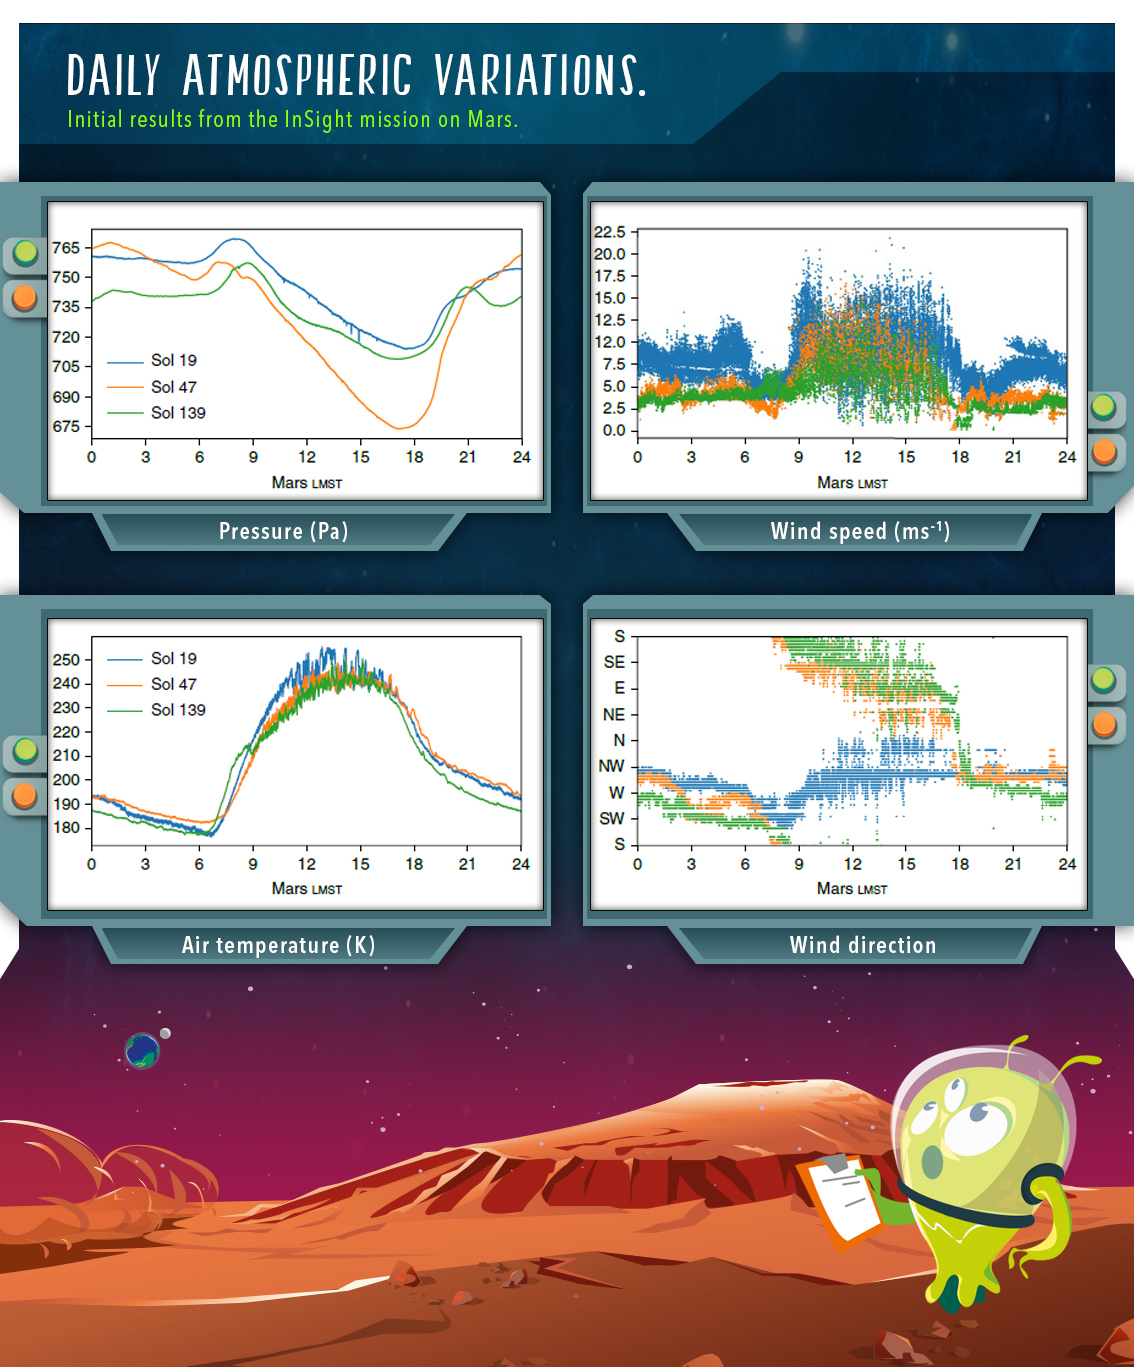
Daily atmospheric variations. (© InSight Science team Banerdt, WB, Smrekar, SE, Banfield, D. et al. Initial results from the InSight mission on Mars. Nat. Geosci. 13, 183–189 (2020) https://doi.org/10.1038 / s41561-020-0544-y).
The variability of these measurements is captured in unprecedented detail.
5-Dust-devils or convective vortices are common on Mars and are seen as sudden drops in pressure as they pass close to the InSight lander.
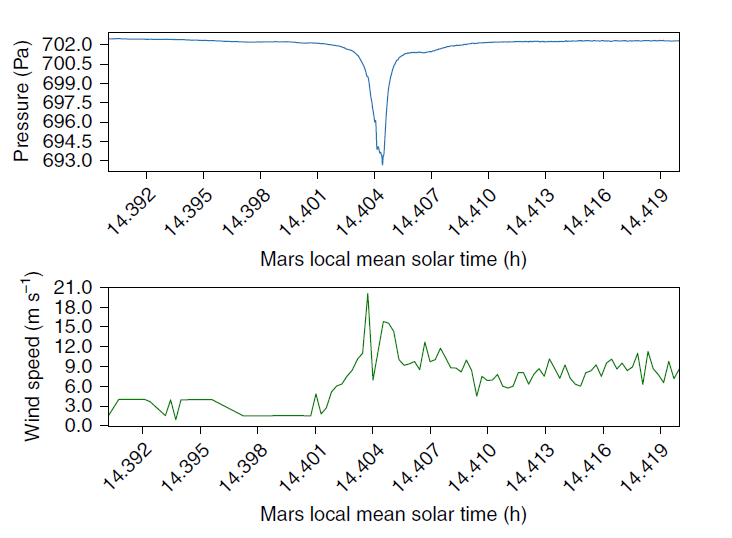
Pressure drop due to a convective vortex (© InSight Science team)
6-These sudden pressure drops have proved to be important events for the InSight science team as they help the seismologists discriminate between marsquakes and atmospheric events.
7-The response of the ground surface to these passing pressure drops has also allowed scientists to determine the physical properties of the near surface.
Satellites have been measuring the magnetic field of Mars from orbit for a number of years.
However these measurements are limited in resolution and can only identify surface features with a minimum scale of 150km.
Having a high resolution magnetometer on the surface provides an unprecedented level of detail, not just in the magnetic field stregth but also how it varies with time.
The magnetic field measured at the surface includes influences from a range of sources.
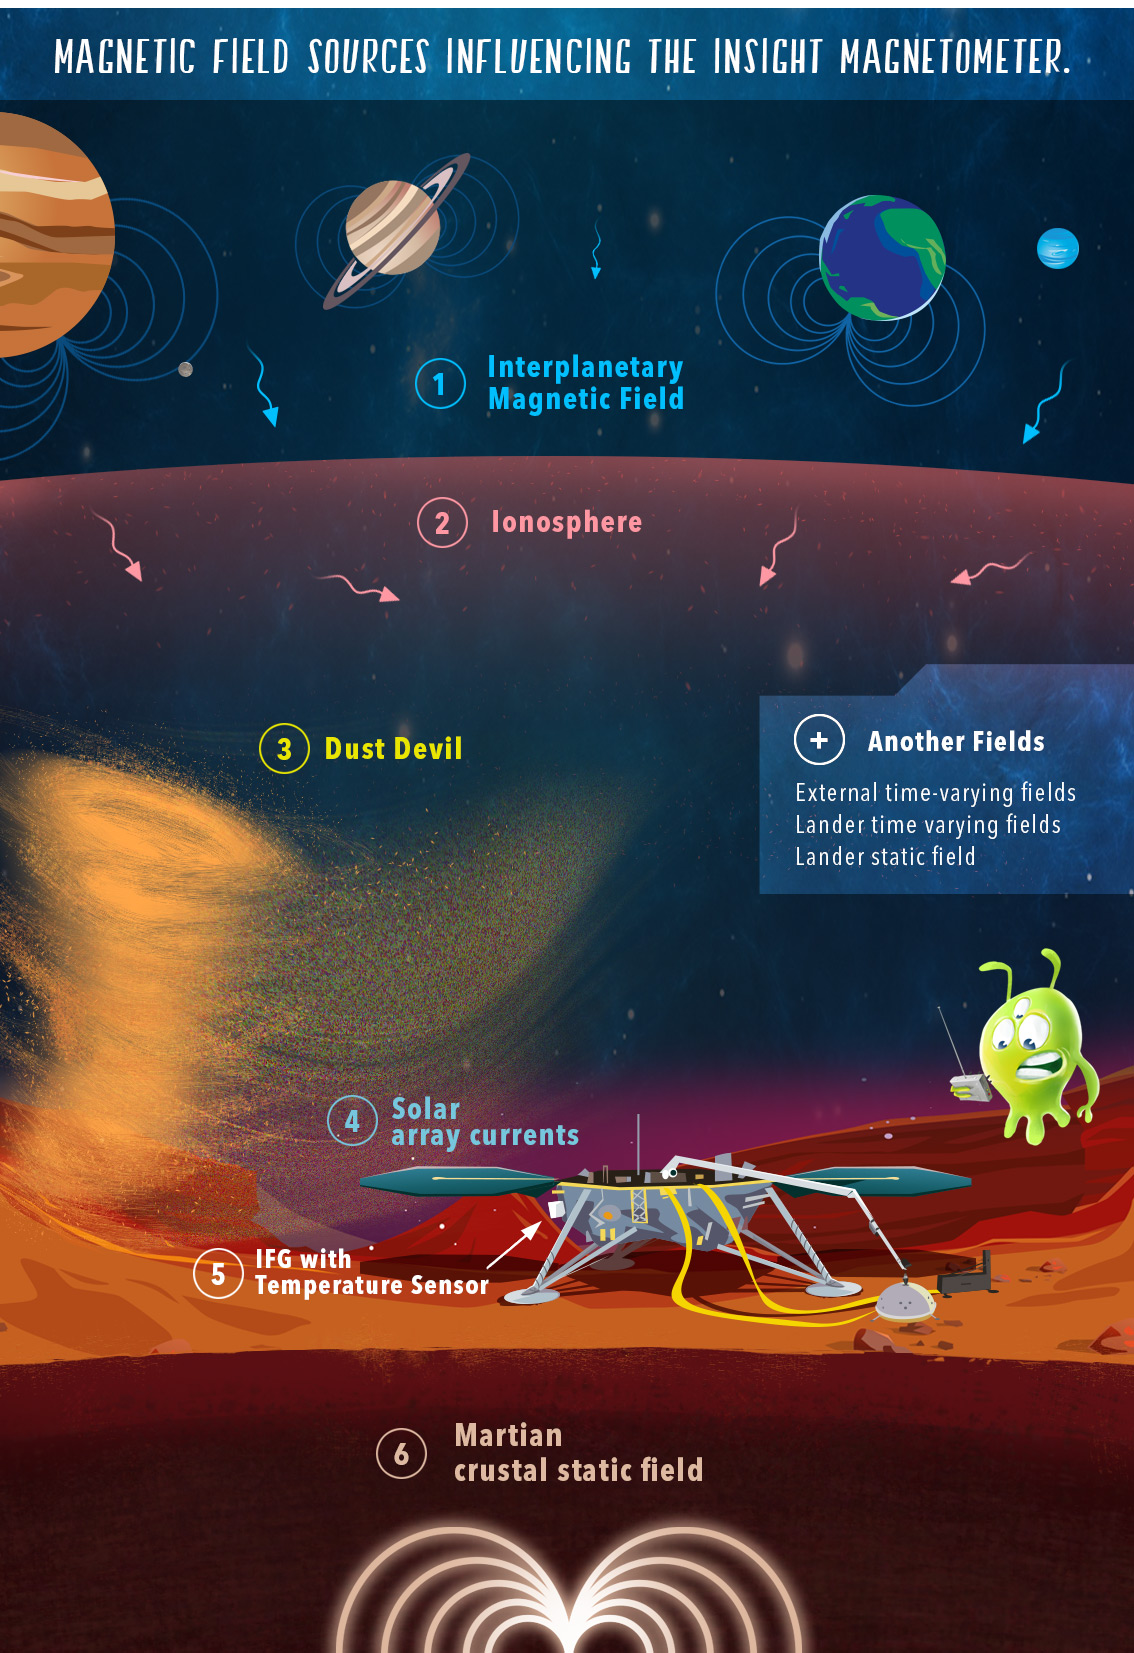
Magnetic field sources influencing the InSight magnetometer (© InSight Science team)
The time varying sources of magnetic field experienced by InSight include daily variations related to atmospheric activity.
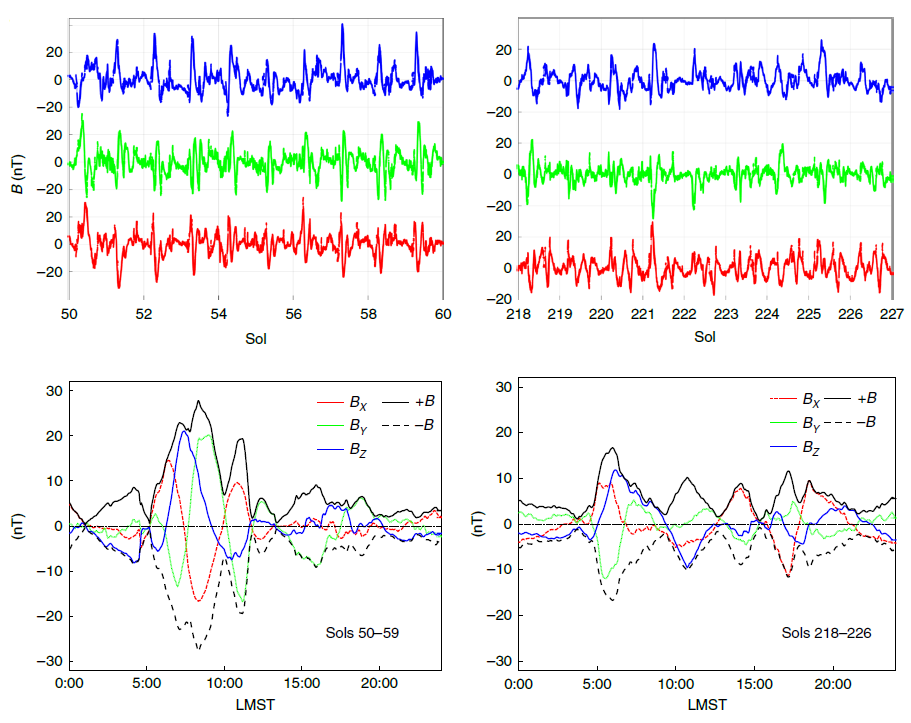
Daily magnetic field variations on Mars (© InSight Science team)
Some of these daily magnetic variatons can be aligned with the meteorological measurements.
The magnetic field strength measured by the magnetometer on the InSight lander at the surface is 10 times stronger than that predicted by satellite-based models.
This can only be explained by the presence of highly magnetised rocks located below the surface within 150km of the lander site.
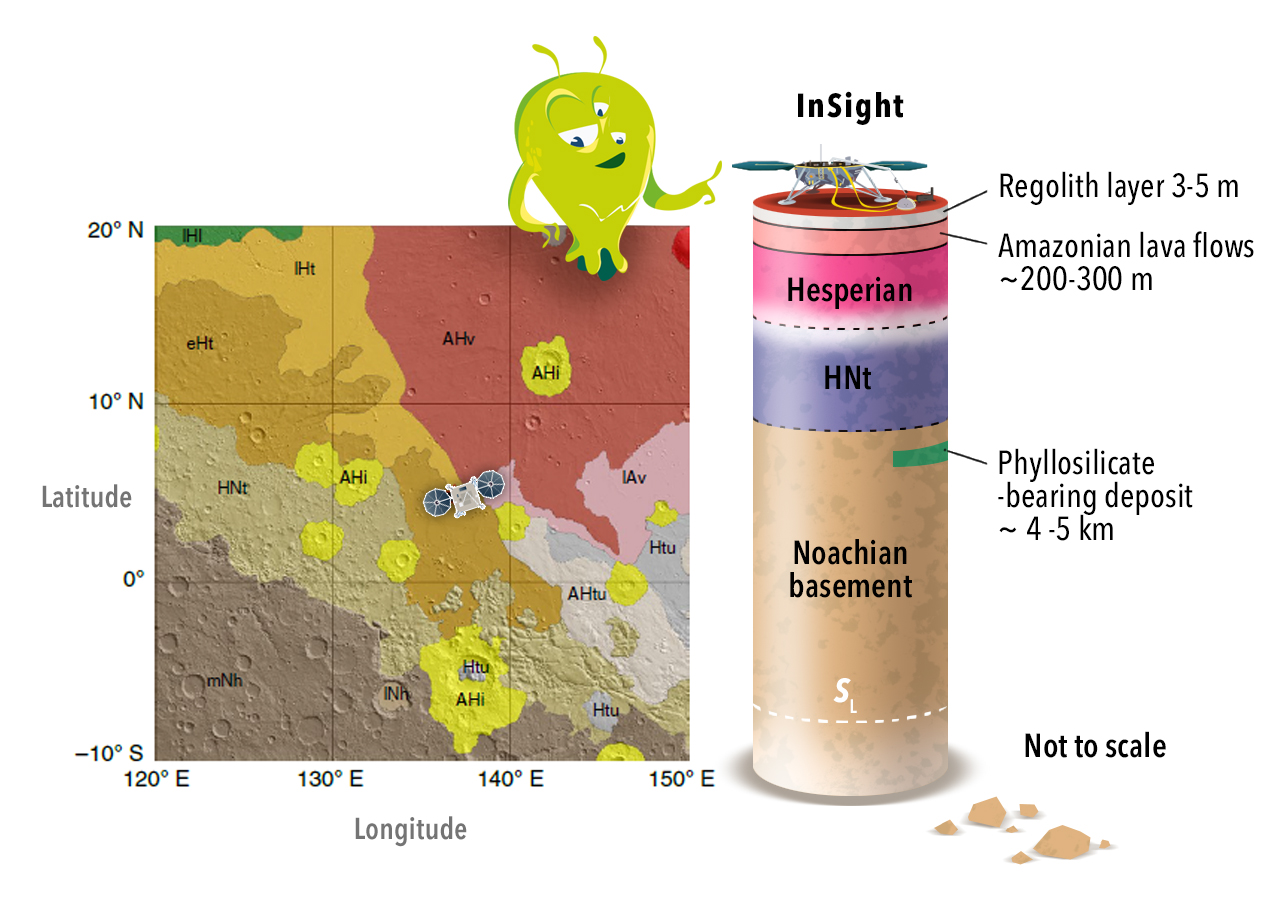
Geological map of InSight lander site and inferred depth section (© InSight Science team)
By combining information from the seismology team about crustal and near surface layering with information about magnetic sources from the magnetometer scientists have inferred a geological depth section beneath the InSight landing site.
Quiz!
Validate your knowledge!
Resources
Information and data from the InSight mission is available from a variety of sources, some is published as soon as it is received, some is held back for a few months to give the mission scientists time to do their initial analysis.

The InSight mission website (© NASA)
The official NASA website for the mission mars.nasa.gov/insight is a good place to start with lots of current information about the InSight project.
This NASA information includes a daily weather report (for the weather two days ago)
Knowing that it takes a day to process the data before you can freely access it on the NASA website, discover the evolution of the Martian weather!
Data that has been downloaded in the standard .sac or .miniseed formats can be analysed with the free Java software SeisGram
SeisGram software(© Lomax)
The software is free to download from the SEIS education team website

https://insight.oca.eu/fr/data-insight#marsview
and is a JAVA executable that can run on Windows, MacOS and Linux computers.
The software can be used to view time series data from the InSight instruments.
SeisGram software spectrogram function(© Lomax)
The SeisGram software can be used to inspect the frequency content of data using spectrogram functions and apply simple frequency filters
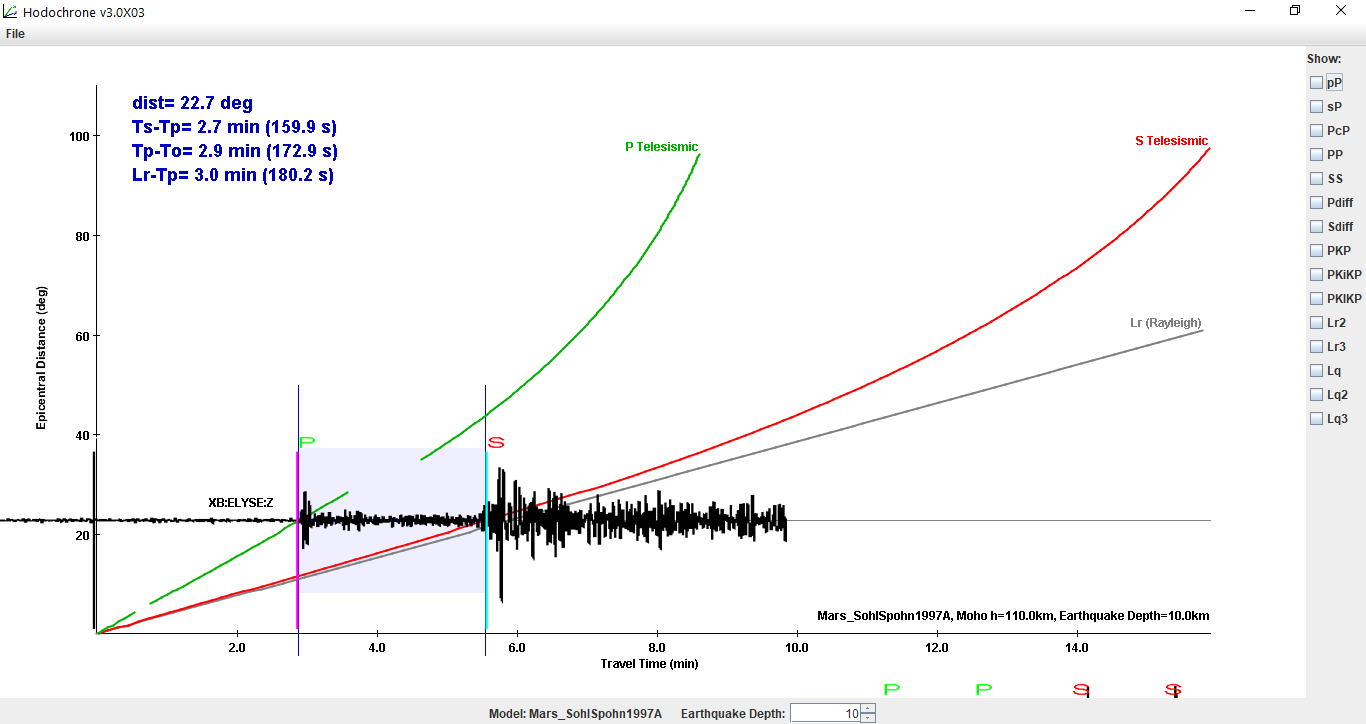
SeisGram software travel time analysis (© Lomax)
The SeisGram software can do simple travel time analysis to work out how far away an event occurred using delay times between P and S waves.
Detecting which direction the waves come from (© P.Denton)
The SeisGram softare can also be used to work out which direction the seismic waves from selected events are travelling in using its particle motion function.
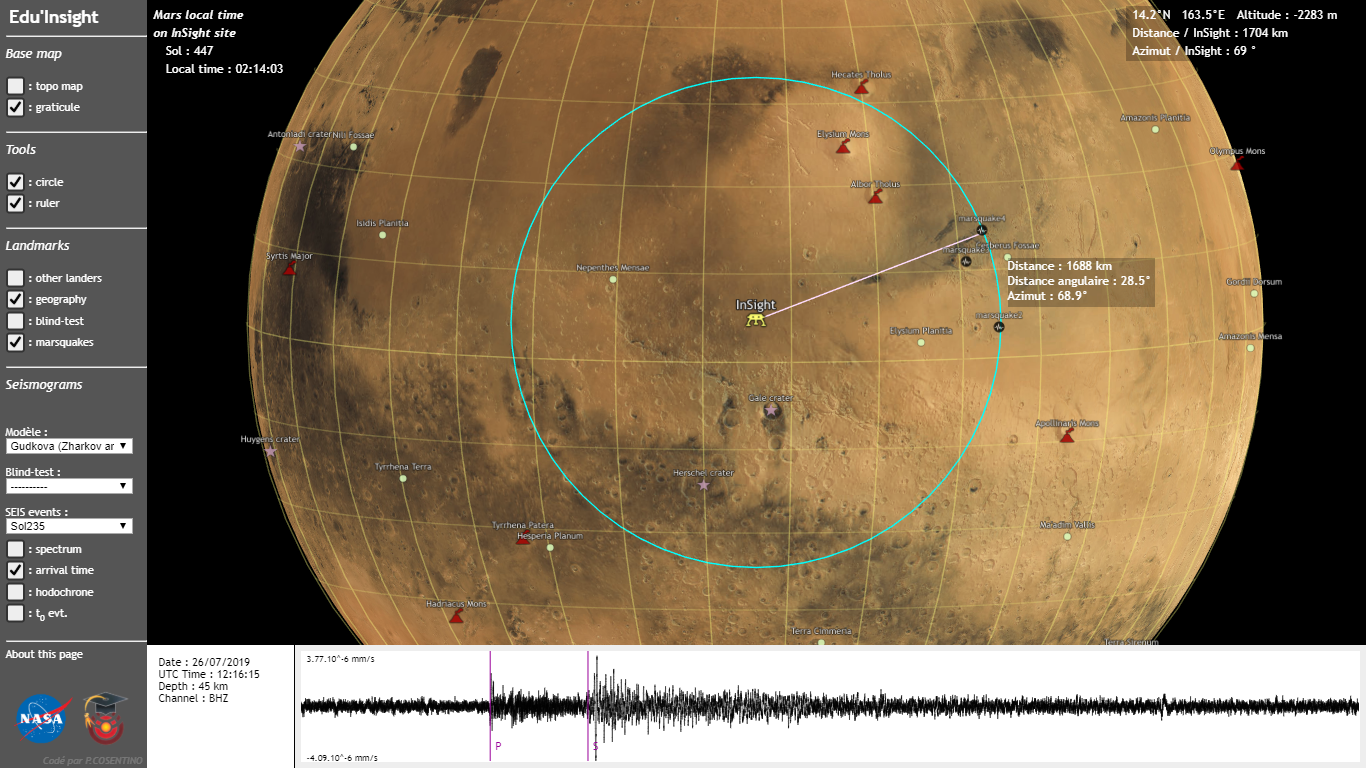
Interactive website for analysing SEIS data from marsquakes (© SEIS team)
The SEIS education team in France have also created an interactive website for working with marsquake event data.
http://philippe.cosentino.free.fr/productions/marsview/
This gives users the ability to interact with selected marsquake event data through a web browser and have a go at locating these events on a map of Mars.
NASA website https://mars.nasa.gov/insight/timeline/surface-operations/ makes it possible to follow the mission on a daily basis.
Previous adventure
End of mission

Next adventure
We would like to thank :
Paul Denton
Denton Seismo Ltd UK,www.dentonseismo.co.uk
Scientific Interaction and English translation
Laurence laffargue-Rieder
German translation
Philippe Labrot
IPGP, Institut de Physique du Globe de Paris, France
Scientific Interaction
Philippe Lognonné
IPGP, Institut de Physique du Globe de Paris, France
Scientific Interaction
Philippe Laudet
CNES, National Centre for Space Studies, France
Scientific Interaction
William Bruce Banerdt
JPL, Jet Propulsion Laboratory, Pasadena, CA, USA
Scientific Interaction
Credits : IPGP, NASA, JPL, CNES, CEA, ETH Zurich and University of Zürich