
|
Menu |


|
Menu |
Seismology on Earth
| For more photos, simply follow Marsty. | |
| For more detailed information, simply follow Cosmo. |
Earthquakes and seismic waves
 Earthquakes and seismic waves
An earthquake is a geological event during which stresses create a rupture, called a fault, within a rocky material. The process of stress concentration takes place over decades, hundreds or even thousands of years.
Accumulation and release of stresses along a fault. (© IRIS)
Energy is released on the fault at the point of the Focus or Hypocentre, in the form of seismic waves which propagate in all directions inside the Earth on its surface.
Seismic waves are elastic waves. They spread in all directions. They distort the rocks they pass through. After the passage of seismic waves, the deformed rocks return to their initial state of equilibrium.
Seismic waves are classified into 2 main families:
1- seismic body waves which pass through the body of the planet.
2- seismic surface waves which travel only on the surface of the planet.
Propagation of seismic body and surface waves. (© Arteclick and IPGP/David Ducros)
1- seismic body waves which pass through the body of the planet. Geophysicists distinguish 2 types: P waves and S waves
P waves, called primary or compression waves, are body waves
P waves arrive first on devices that measure their amplitude and frequency called seismometers.

Animation of a seismic P wave (© Wolfram)
P waves are the fastest seismic waves. They move with a speed of the order of 6 kilometres per second (km/s) in the Earth’s crust and can reach 14 km/s in the Earth’s interior.
P waves propagate in all media, solids, fluids, gases, and even in the atmosphere.
When the P wavefront passes, the rock undergoes a compression-extension deformation. This expansion-compression movement is parallel to the direction of propagation of the P wave. Once the P wave has passed, the rocks resume their initial shape.
Like the P wave, sound is a longitudinal wave that propagates through the air.
S waves, called secondary or shear waves, are body waves
S waves are slower than P waves. They are therefore recorded by seismometers after P waves, hence their name of secondary waves. They propagate at speeds varying from 4 km/s to 6 km/s.
S waves cause shearing motion perpendicular to their direction of propagation.
Animation of a seismic S wave (© Wolfram)
These shear waves cannot propagate in liquids. The outer part of the metallic core of the Earth is liquid and it makes an impenetrable barrier for S waves.
S waves only propagate in solids.
2- Seismic surface waves only travel on the surface of a planet. Geophysicists distinguish two types : Rayleigh waves and Love waves.
When the P and S seismic waves interact with a free surface, the reflections and reverberations with this surface create a type of wave that travels only near the surface of the planet, these are surface waves.
Slower than S waves, these surface waves propagate at around 4 km/s. But the surface waves have larger amplitudes than the P and S waves.
They are the cause of the most significant damage that occurs during earthquakes.
Rayleigh waves
As you can see on the simulation below, the Rayleigh waves move in a complex way. The movement of the particles in these waves is elliptical and its amplitude decreases with depth.
Simulation of the propagation of the surface seismic wave, called Rayleigh wave. (© Wolfram)
Rayleigh waves are similar to ocean waves. They are created by P and S waves, which interact with the free surface of the planet.
Love waves
On Earth, Love waves are responsible for most of the damage caused by violent earthquakes. The way they move gives them great destructive potential, in particular for buildings and structures not designed to withstand earthquakes.
Simulation of the propagation of Love surface wave. (© Wolfram)
Deep mantle earthquakes do not create surface waves. Surface seismic waves are only created when the focus of an earthquake is close to the surface in the crust.
In a homogeneous medium, the seismic waves recorded are P, S and surface waves.
When the P and S waves propagate inside the Earth’s interior, they have to cross interfaces separating two media with different physical properties. These so-called incident waves undergo reflection and refraction phenomena. Then, these P and S waves are reflected and refracted (like light) at the interface of the different geological layers.
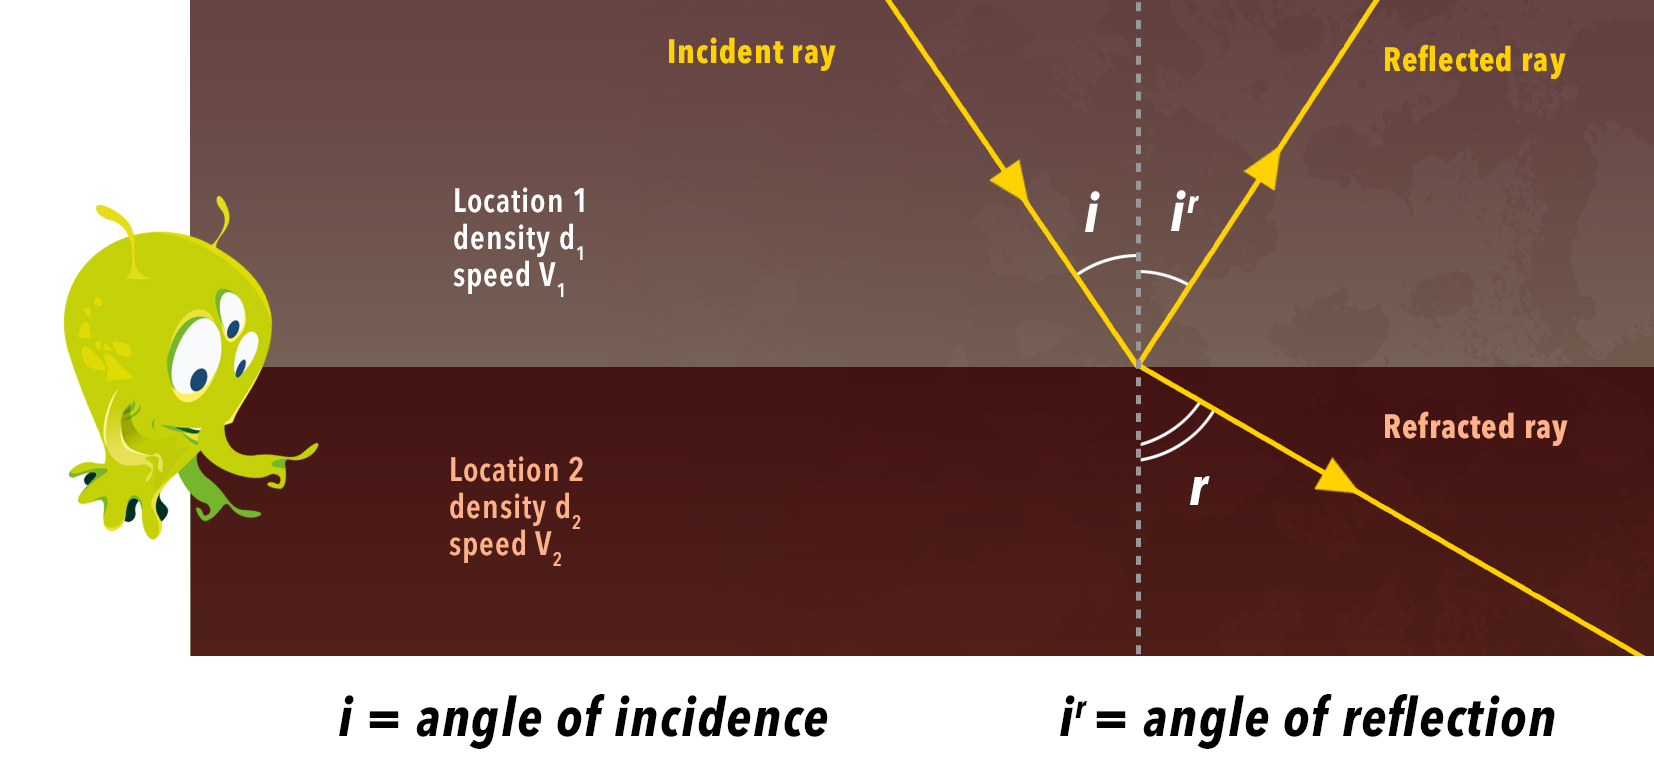
The path of an incident (or direct) wave, which is reflected and refracted when it encounters a geological interface separating two media with different physical properties. (© Arteclick)
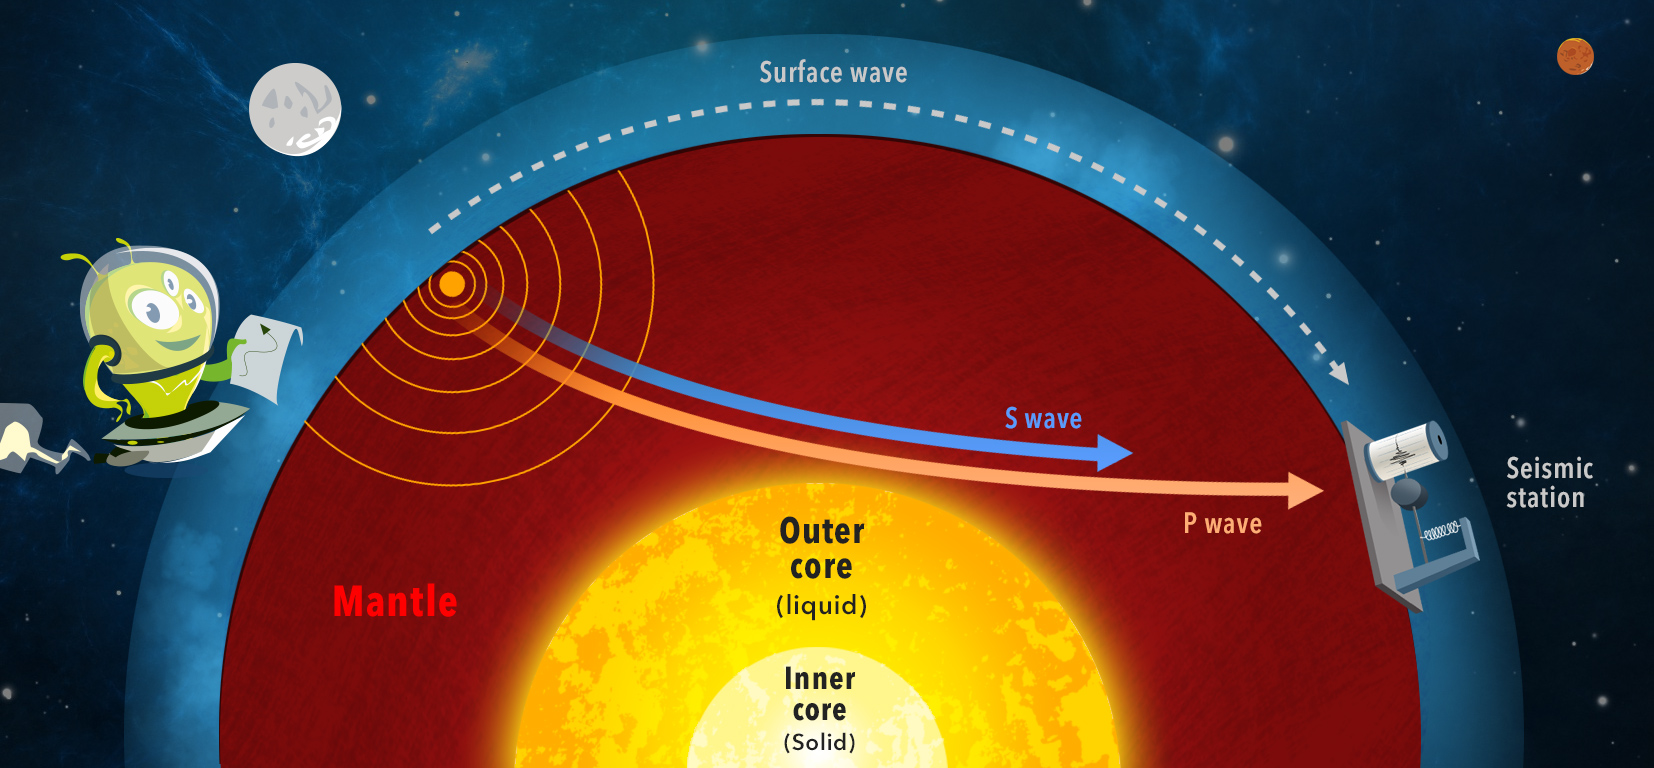
P waves: primary, fast waves propagate in all media. S waves: secondary, slower waves, do not propagate in liquid media.
Direct and reflected S-wave path (yellow). Path of direct, reflected and refracted P-waves (brown). P-waves pass through the Earth's core. (© Arteclick)
A fault is a tectonic structure consisting of a plane or a rupture zone along which two rock blocks move relative to each other. It is the sudden displacement of these blocks along this plane which causes the sudden release of energy which is an earthquake. These diagrams divide a rock volume into two sections which can slide relative to one another.
The faults are classified according to their movement:
1-Normal fault, is an inclined plane of approximately 60° which separates two blocks. The sliding on this fault plane results in a separation of the two blocks and in the lowering of the upper block relative to the lower block. This movement is created by extensional forces and causes horizontal elongation.
Normal fault. (© IRIS)
2-Reverse fault, is an inclined plane of approximately 30° which separates two blocks. The sliding on this fault plane results in the bringing together of the two blocks and in the lifting of the upper block relative to the lower block. This movement is created by compressive forces and causes a horizontal shortening.
Reverse fault. (© IRIS)
3-Oblique fault, this movement of the fault combines an opening (or closing) and a slippage. This type of movement is created by a combination of shearing forces and extensional (or compressive) forces.
Oblique fault. (© IRIS)
4-Transform fault, the movement between the blocks on either side of the fault is horizontal. If, as in the animation, the right block goes to the left (relative to the other block), the fault is said to be sinistral or left-lateral (and dextral or right-lateral in the opposite case). This movement is created by shear forces.
Transform fault. (© IRIS)
But in nature fault types are combined and form very complicated structures
When we see the effects of an earthquake, the vibrations, the buildings that move, we wonder how directly the movements of the fault trigger an earthquake.
Consider a fault zone in the Earth’s crust by defining its depth and height. The point on the fault that will break first, due to the stresses accumulated in the rocks, is located in the deepest, most fragile, most sressed point called the focus or hypocentre. When the stress becomes too great, the fault begins to slide very quickly from a few centimetres to a few metres.
In sliding, this part of the fault will drag with it the rest of the fault and induce a slip which will propagate gradually over a certain length of the fault, to finally stop. This slip is proportional to the length (L) of the fault, with a displacement of the order of 1,000 to 10,000 times smaller than L.
The speed of propagation of this slip is approximately 3 km/s (V = 3 km/s).
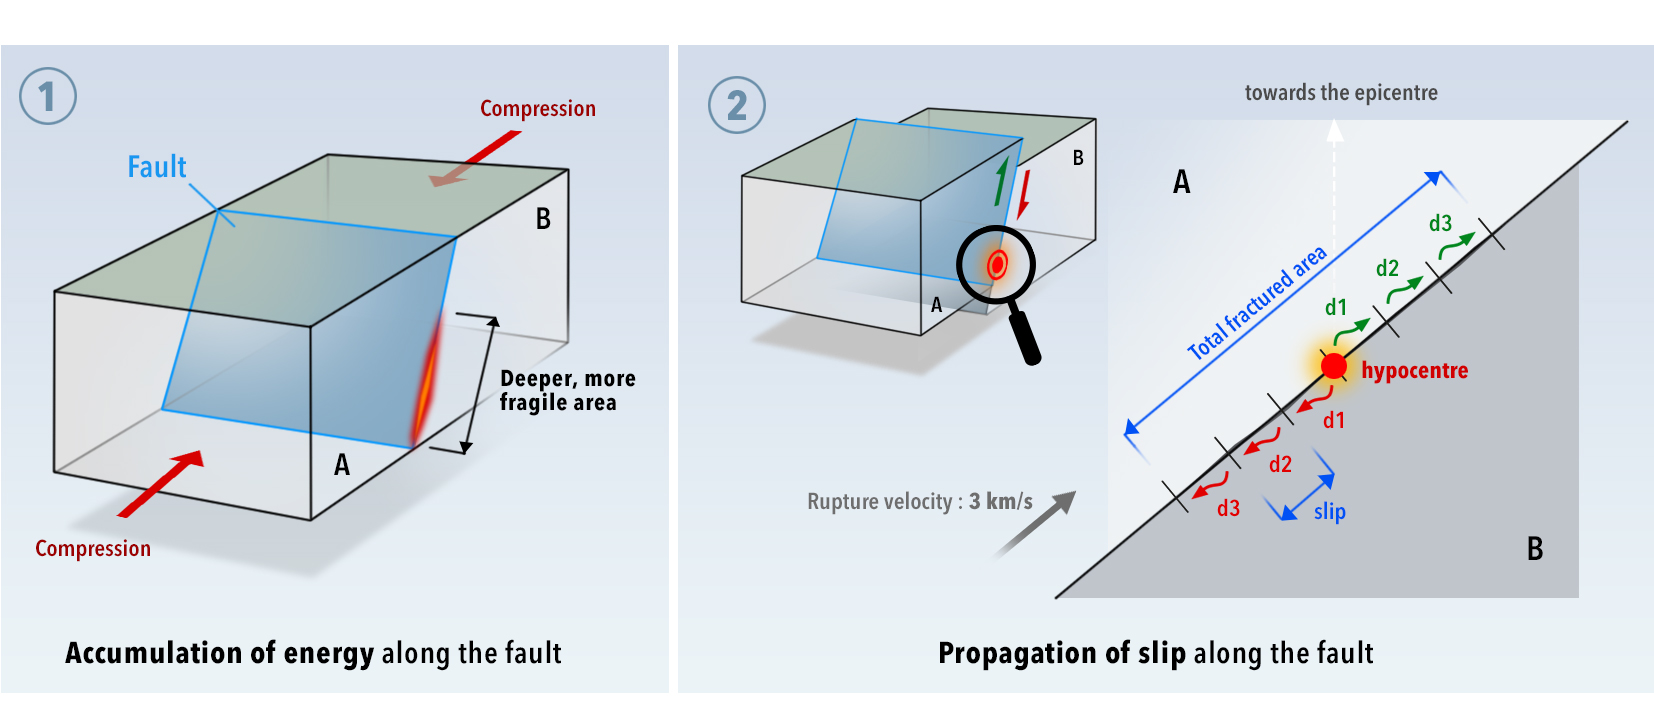
Accumulation, stress release and sliding along a fault. (© Arteclick)
The energy release associated with this stress release depends on the length of the fault. Since the fault is a 3-dimensional space, the amount of energy released is not linear but logarithmic. This means that if we have another fault that is 10 times the length of our fault, its released energy will not be 10 times greater but 1000 times (10 x 10 x 10).
For example:
For a fault of 5 km in length (L = 5 km), the sliding time, with a breaking speed V = 3 km / s, is approximately 1.5 seconds. Its sliding distance (d) would be approximately 25 cm. A certain amount energy is released, let’s call it E.
Now take a fault 10 times larger, then its length is L = 50 km, the sliding time will be around 15 seconds, the sliding distance is around d = 2.50 metres, the energy released is 1000 E.
Finally, for a fault 100 times larger then its length is L = 500 km, the sliding time is around 150 seconds, the sliding distance is d = 25 metres, the energy released is 1000 times 1000 E, or 1’000’000 E.
To compare the quantity of energy released between different earthquakes, you can calculate the magnitude of these events. This magnitude is closely related to the amount of energy released, as it is represented by the logarithm of this amount of energy.
To use the examples above:
The fault of length L = 5 km will have magnitude 5. The fault of length L = 50 km will have magnitude 7. The fault of length L = 500 km will have magnitude 9.
Finally, once the fault begins to move, the slip generates vibrations or seismic waves in the rocks which propagate in all directions in the Earth as well as towards the surface. The speeds of these waves are 6km/s for the fastest waves, called P waves which compress and expand the rock, while the S waves are twice as slow (3 km/s) and have a shearing motion in the rocks.
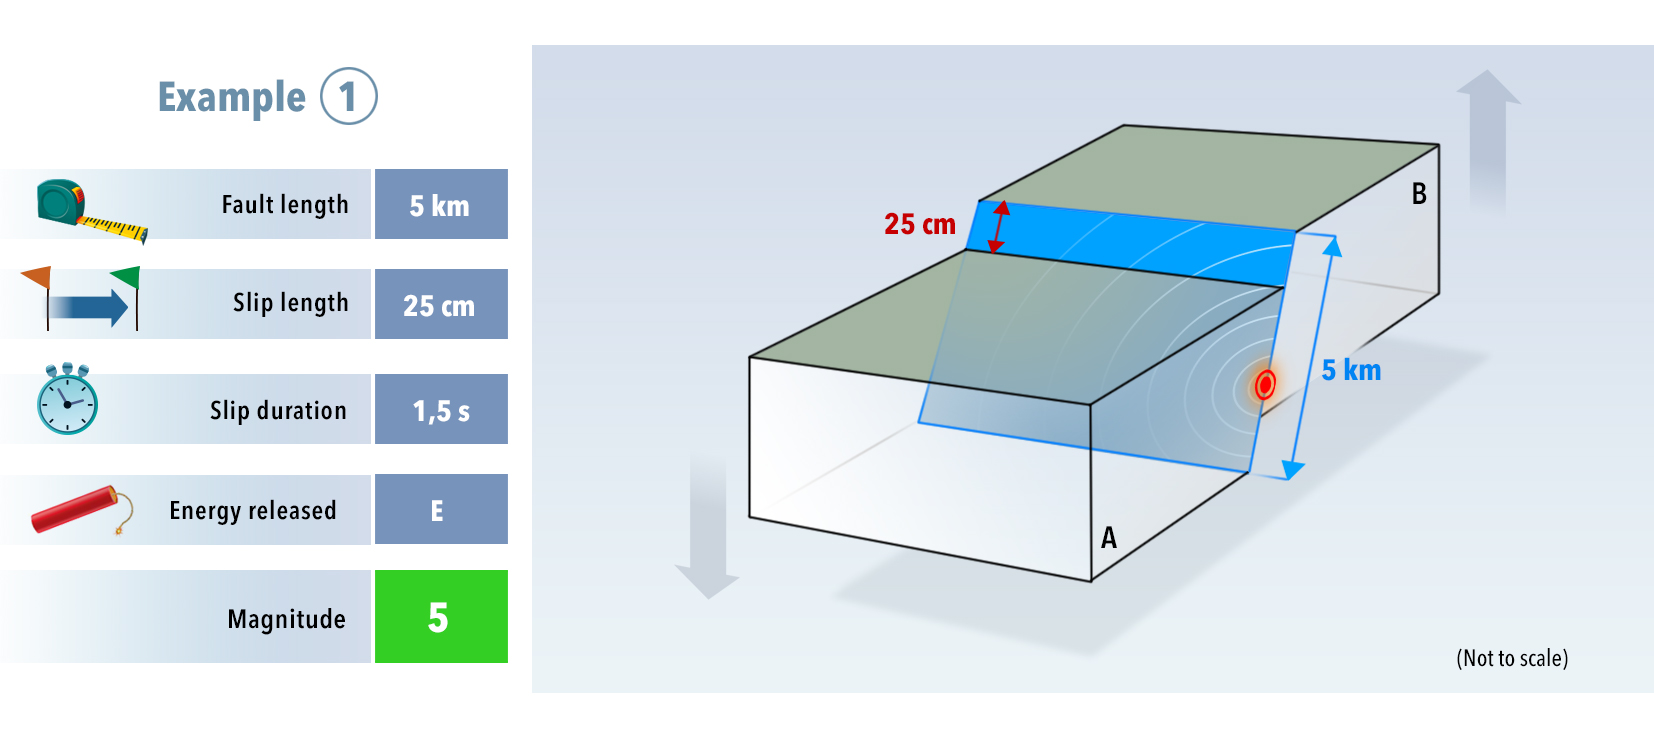
Relationship between fault length 5 km, slip length 25 cm, break time 1,5 s and magnitude 5. (© Arteclick)
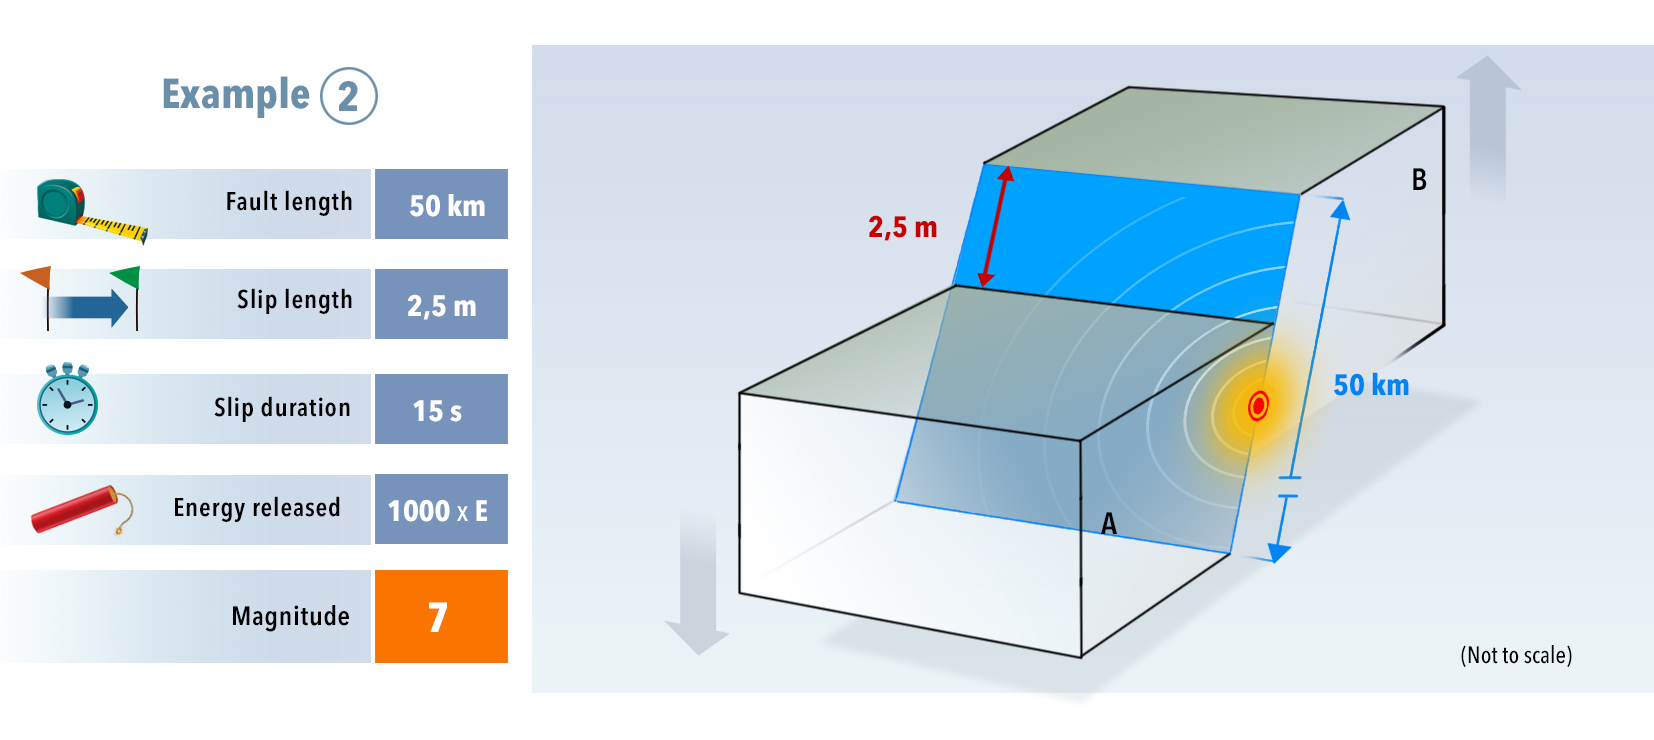
Relationship between fault length 50 km, slip length 2,5 m, break time 15 s and magnitude 7. (© Arteclick)
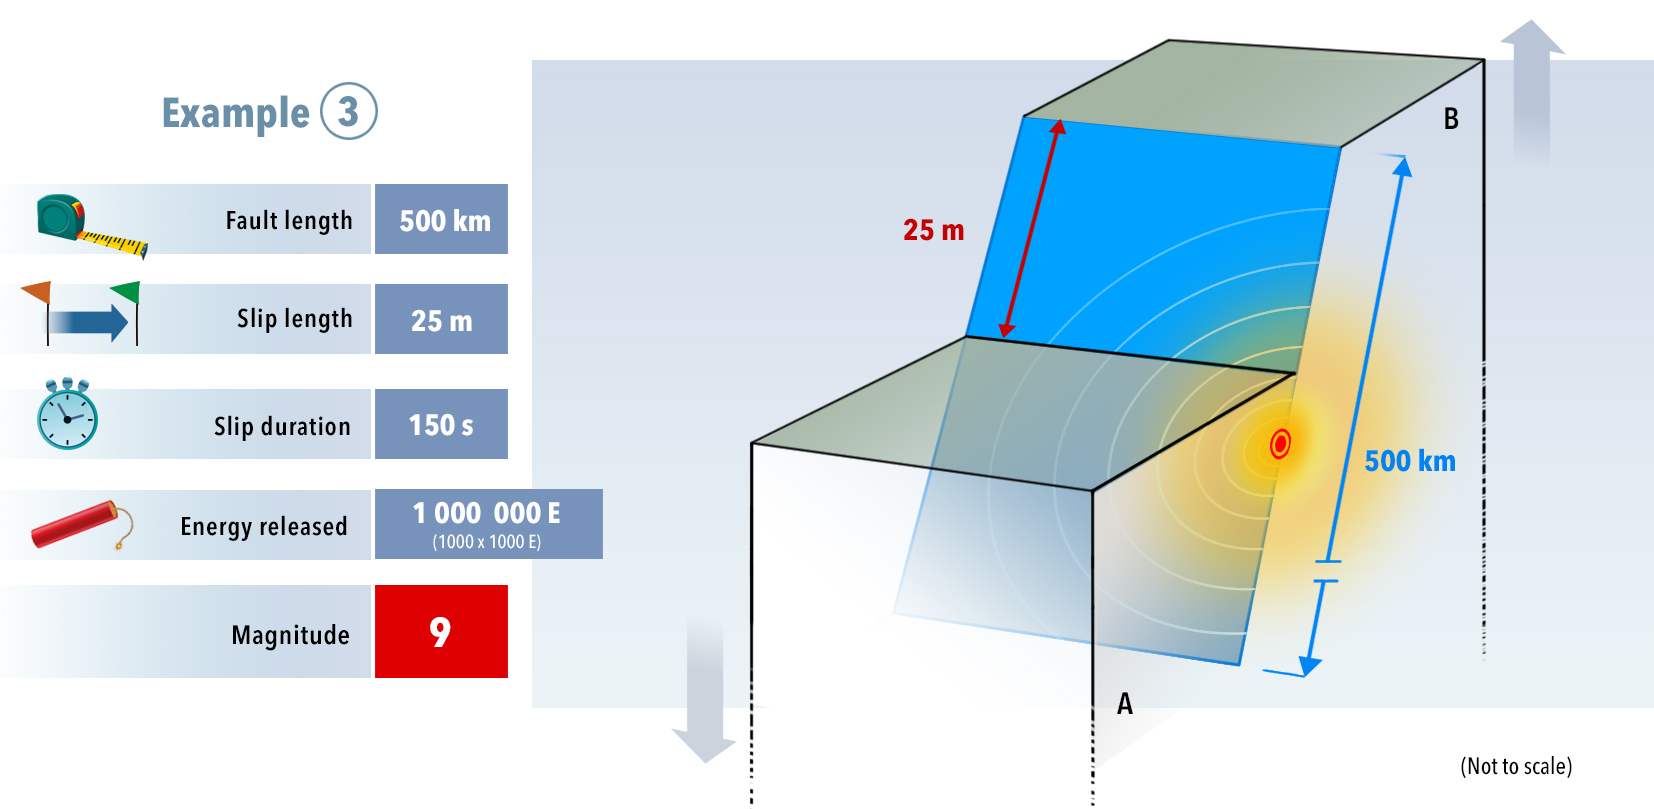
Relationship between fault length 500 km, slip length 25 m, break time 150 s and magnitude 9. (© Arteclick)
Quiz!
Validate your knowledge!
Studying earthquakes on Earth

Earthquakes are permanent witnesses to the activity of the Earth, earthquakes are distributed along boundary lines, which divide the globe into large oceanic and continental regions, more or less devoid of seismic activity, called tectonic plates.
These tectonic plates are separated by faults where the plates slide relative to each other. Subduction zones are the places where one plate slides under another plate. Divergent boundaries are the places where two plates move away from each other (see adventure 3, step 2 the percolator of the Earth, to understand the functioning of plate tectonics).
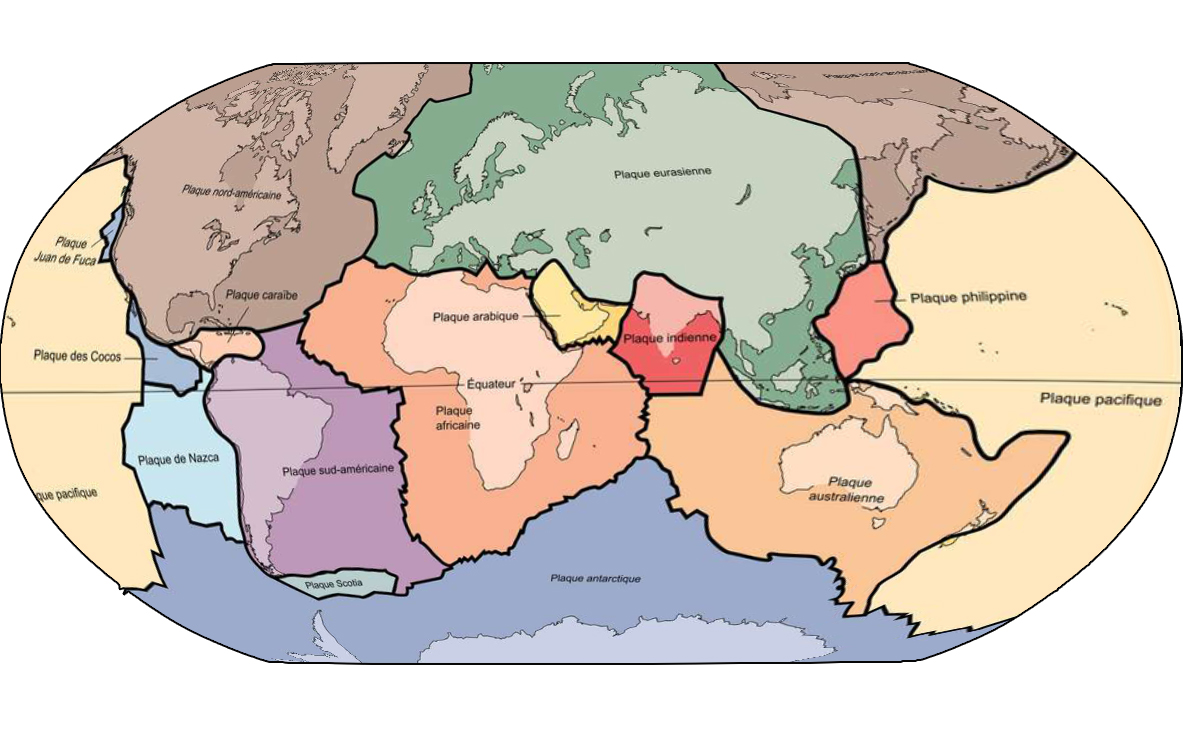
Currently scientists agree on large tectonic plates distributed over the Earth's surface. (© USGS, Wikipedia)
Since the Earth is in constant motion, the oceanic crust is regularly subject to fractures which cause violent earthquakes, which over time break the tectonic plates. For example, in 2012, two megaseisms in the Sumatra region resulted in significant fracturing of the Indo-Australian plate. Also, the earthquake in Mexico in 2017 was so powerful that it cracked the Cocos plate up to 80 kilometres deep.
The epicentres of recent earthquakes are divided into three main zones: a) the circumpacific zone and the Antilles loop, which represent 80% of annual seismic activity, b) the oceanic ridge zones, c) a zone located at the boundary between the Eurasian and African continents, from the Azores to Java.
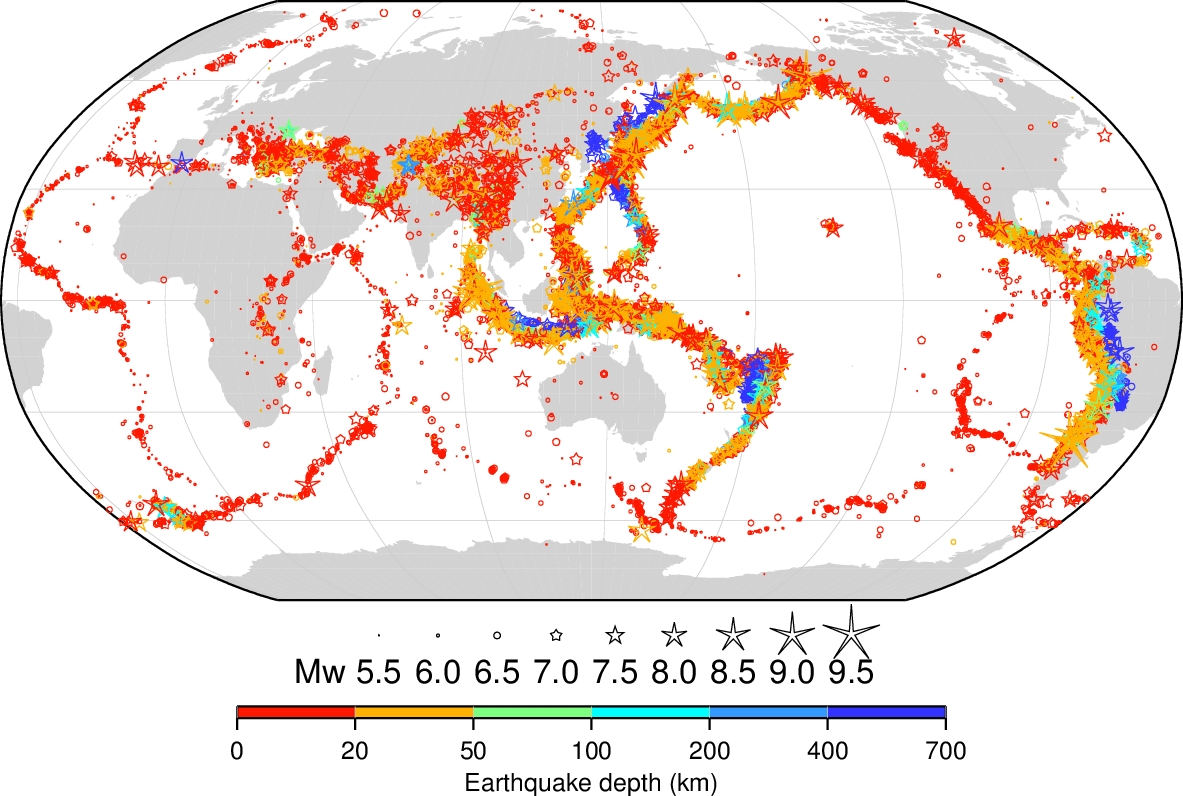
Map of the location of earthquakes with magnitude greater than 5. (© ISC)
Seismologists distinguish surface earthquakes less than 60km deep, intermediate earthquakes from 60 to 300 km deep, then deep earthquakes with depths from 300 to 700 km (there are none deeper than this). It should be noted that 95% of earthquakes in the world occur at a depth less than 60 km and only 5% occur at a depth greater than 60 km.
Global networks
For over a hundred years the Earth has been covered by networks of seismometers. Scientists therefore have access to data from thousands of seismic stations around the world and are able to draw a detailed picture of the movements within and at the edge of the tectonic plates. .
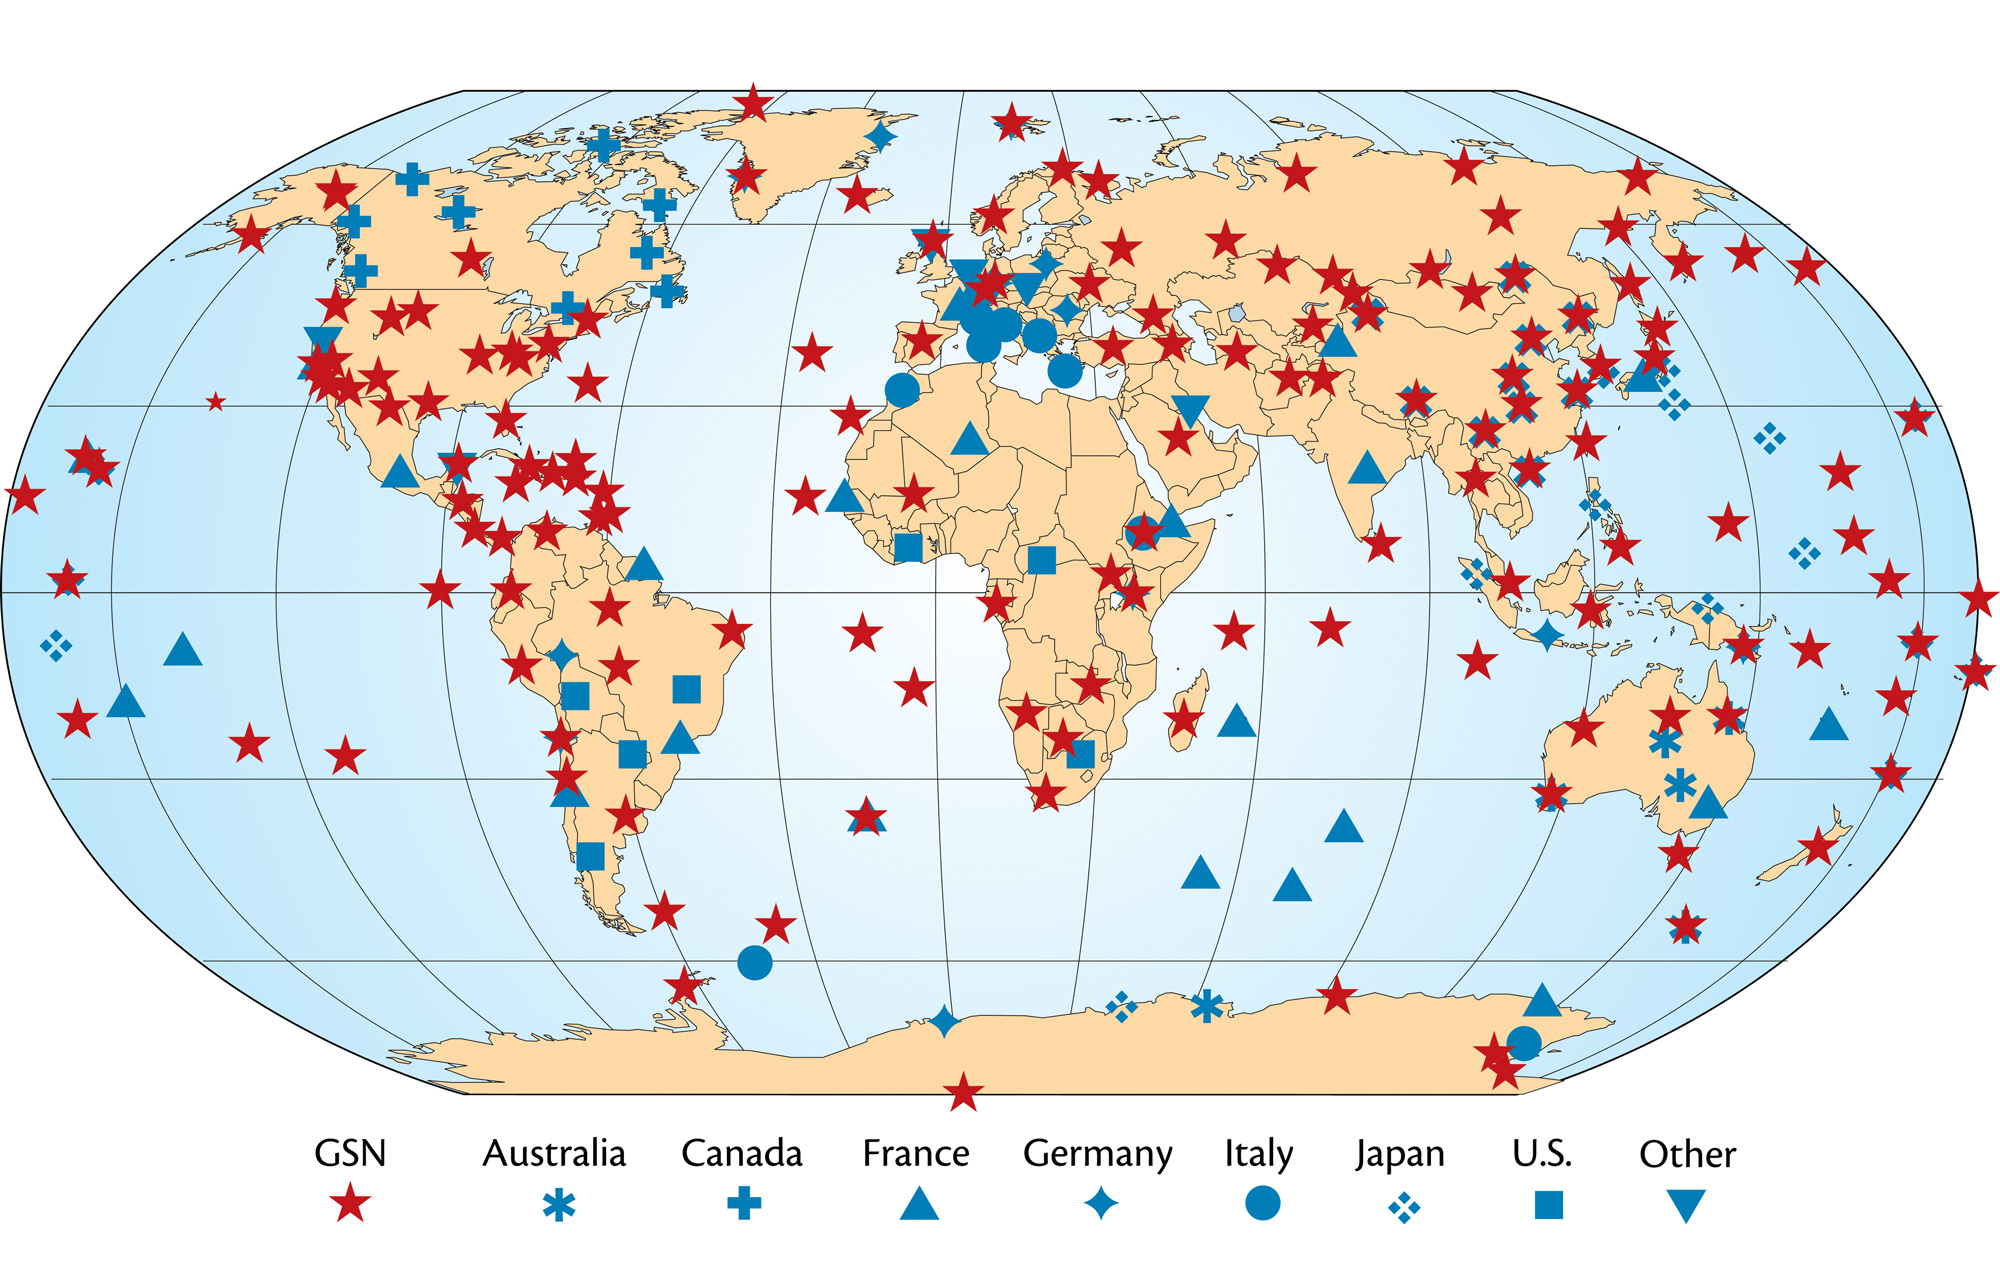
With so many seismic stations spread over the Earth's surface, scientists are confident to be able to detect and locate each earthquake that occurs anywhere on Earth if its magnitude is greater than 5. (© IRIS)
Seismographs capture and record the vibrations caused by seismic waves. Seismographs are made up of a fixed part and an independent mobile part.
The base of the device and the recording cylinder are fixed to the ground and vibrate with any shaking of the ground. The suspended mass tends to stay motionless. The mass therefore moves relative to the recording cylinder, which creates a signal.
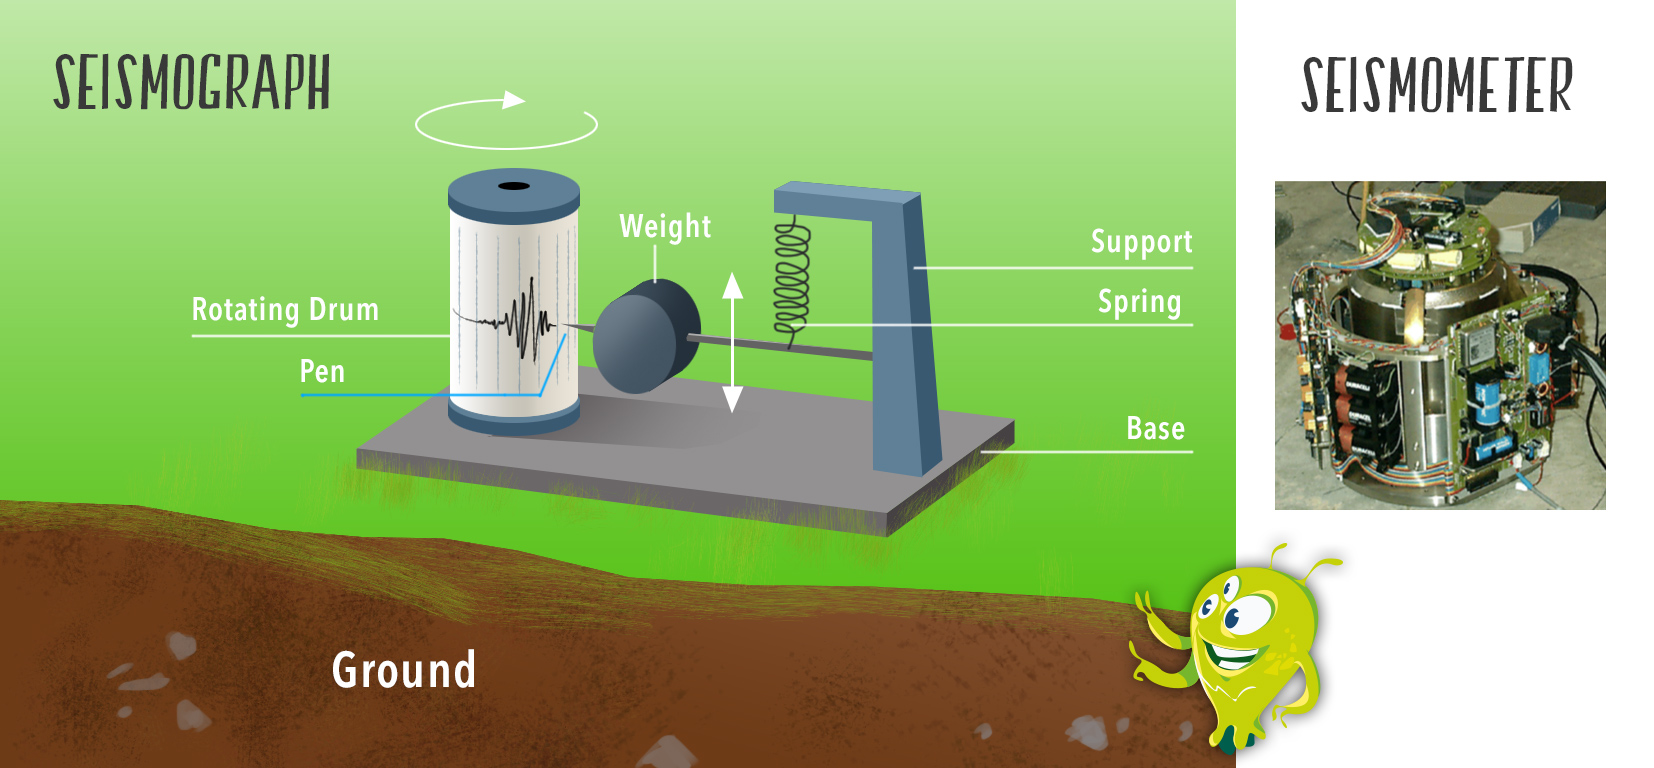
Seismograph and seismometer. (© Artéclick)
The seismometer is the modern version of the seismograph. It is an extremely sensitive electro-mechanical instrument capable of detecting very small movements of the ground and recording them.
This small animation shows how it works.
A seismogram is a graphic recording made by a seismometer. The abscissa (x-axis) represents time while the ordinate (y-axis) represents the instantaneous value of the acceleration,volocity or displacement of the point of measurement of the seismic wave along an axis.
Seismograms are used to locate earthquakes and calculate their magnitude.
Considering that the magnitude of the earthquakes is a function of the amount of energy released by the rupture, and that the seismogram is the recording of the seismic waves which propagate during an earthquake, we therefore use the seismograms to locate earthquakes and calculate their magnitude.

Simplified seismogram showing by order of arrival at the seismometer the P waves, then the S and finally the surface waves. (© Pierre André Bourque)
Time is represented on the horizontal axis and displacement is represented on the vertical axis.
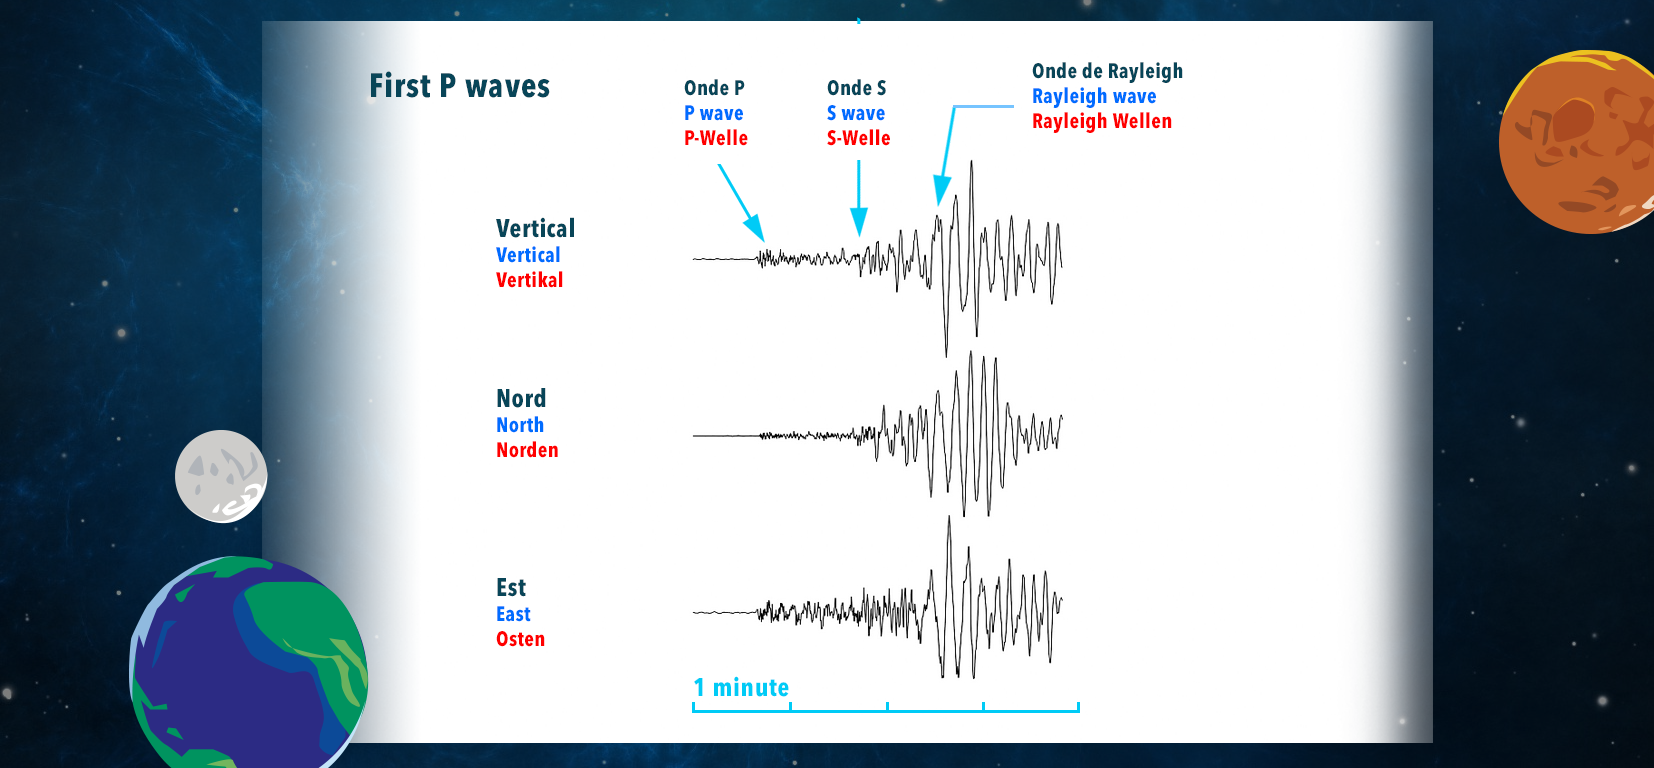
The time runs from left to right in the diagram for 60 seconds, the three traces indicate the vibration of the ground in the vertical (V), north-south (N), and east-west (E) directions..(© eost.u-strabg)
On the left, the movement of the ground without any seismic waves but with small movements due to the wind etc. Then the energy of the earthquake arrives, with the P waves (primary and compressive), very visible on the vertical traces (V) and east-west (E).
Then, the S waves (secondary and transverse) slower than the P waves, are clearly visible on the north-south recording (N). Then lastly, the surface waves (here the Rayleigh ones) arrive.
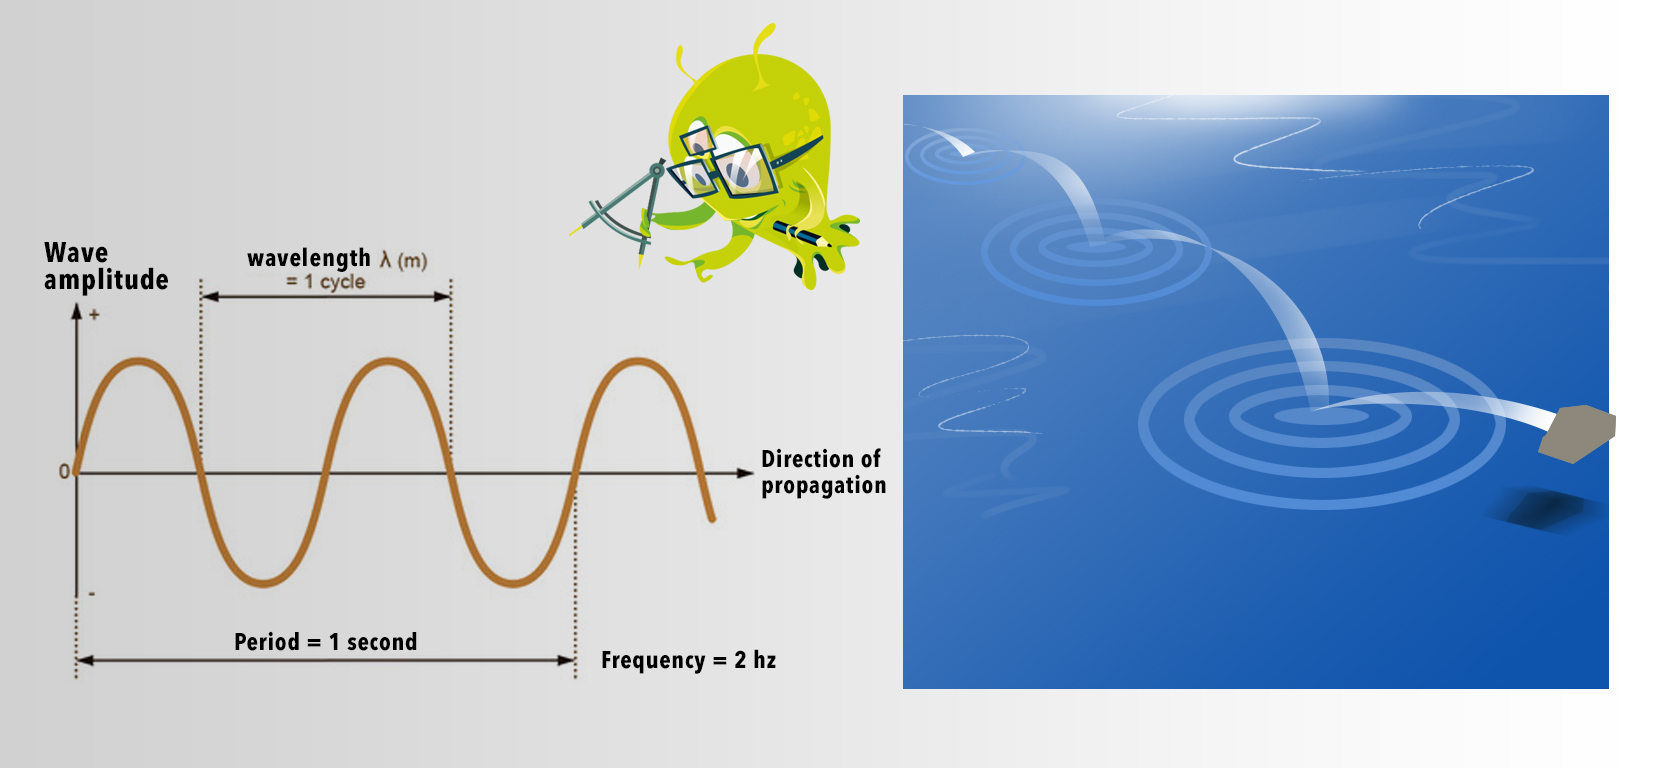
Schematic representation of a seismic wave. Illustrating amplitude, period, frequency, and direction of propagation. (© IPGP/David Ducros)
Studying a seismogram makes it possible to know: the speed of propagation of the waves, their amplitude, their frequency, their direction, and their type. From these analyses it is then possible to locate the focus and the epicentre of the earthquake and also to determine its magnitude.
Seismic waves propagating in the Earth to reach the 4 seismometers located on the surface. (© IRIS)
While the focus (or hypocentre) indicates the starting point of the seismic rupture during an earthquake, the epicentre represents its vertical projection onto the Earth’s surface.
By measuring the speed of the P and S waves associated with an earthquake, and by measuring the time between the arrival of the P waves and the arrival of the S waves at a given seismometer, it is possible to estimate the distance between the seismometer and the seismic hypocentre. Then, by combining the data recorded by at least 3 seismometers, we can determine the epicentre of the earthquake with precision.
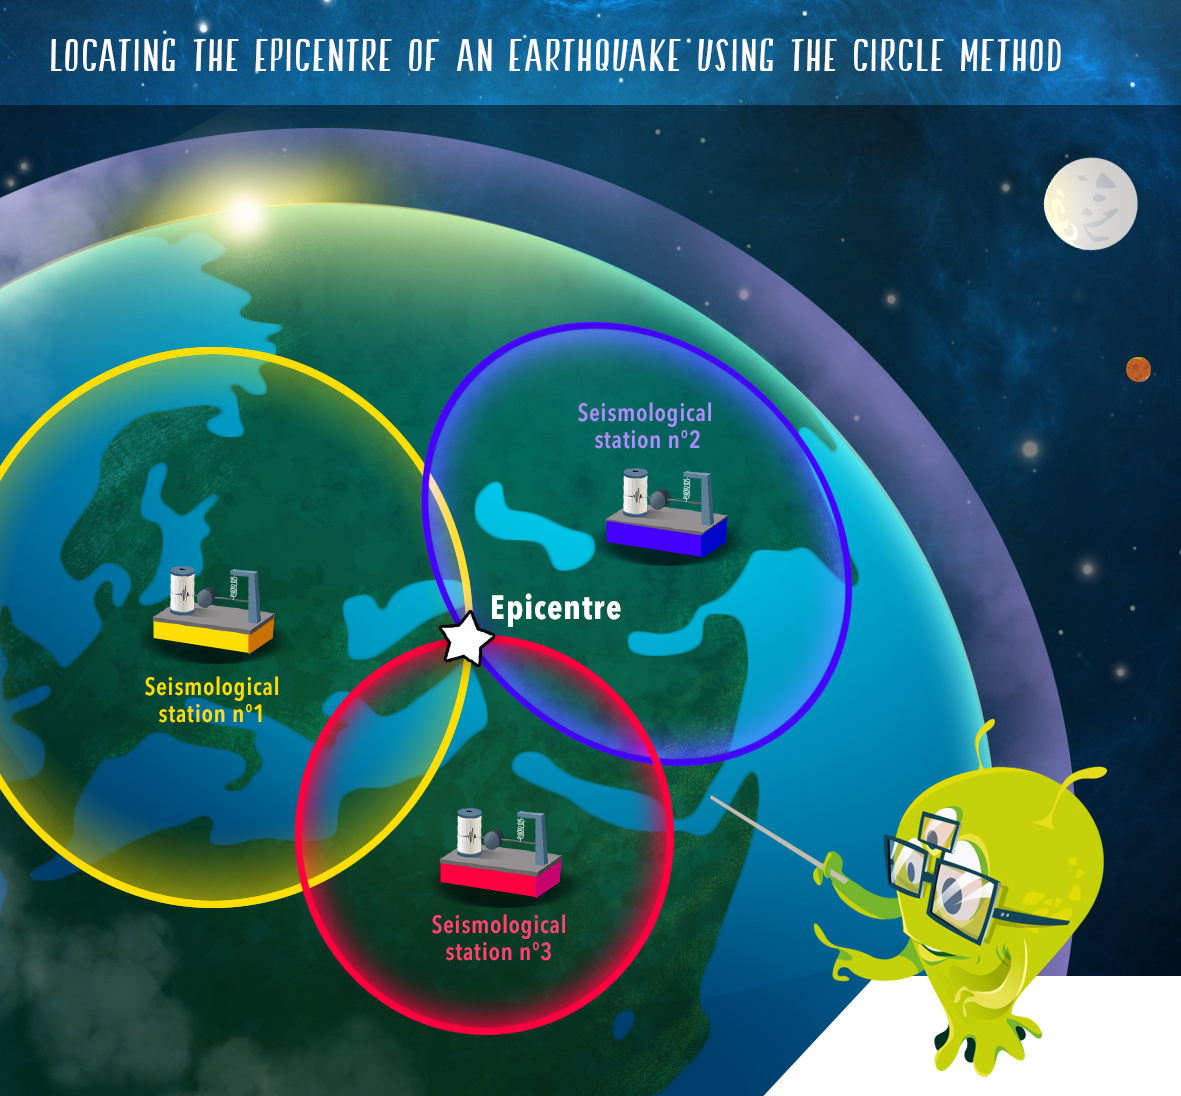
Location of the epicentre of an earthquake using the circle or triangulaton method.
Knowing the position of three (1,2,3) seismic stations which have detected the earthquake and the distance between each station, we first draw a circle whose radius corresponds to the distance separating the hypocentre of the earthquake from station 1. (In the same way we draw the circles for stations 2 and 3. For more details about the calculations of these different stages, it is necessary to refer to earthquake study websites.)
We then see 3 arcs of circles which intersect at 1 point if the earthquake is close to the surface. The position of the epicentre is determined by the point of intersection.
Find the epicentre of an earthquake by the circle method. (© Arteclick)
Thanks to seismic waves, scientists can identify and study the internal structure of the Earth.
At the beginning of the 20th century, seismologists installed seismometers all over the world, to record the waves produced by large earthquakes anywhere on Earth. Thanks to these networks they were able to determine the internal structure, the size and the nature of the different layers of the terrestrial globe.

Global network of seismometers to study the Earth's internal structure. (© Arteclick)
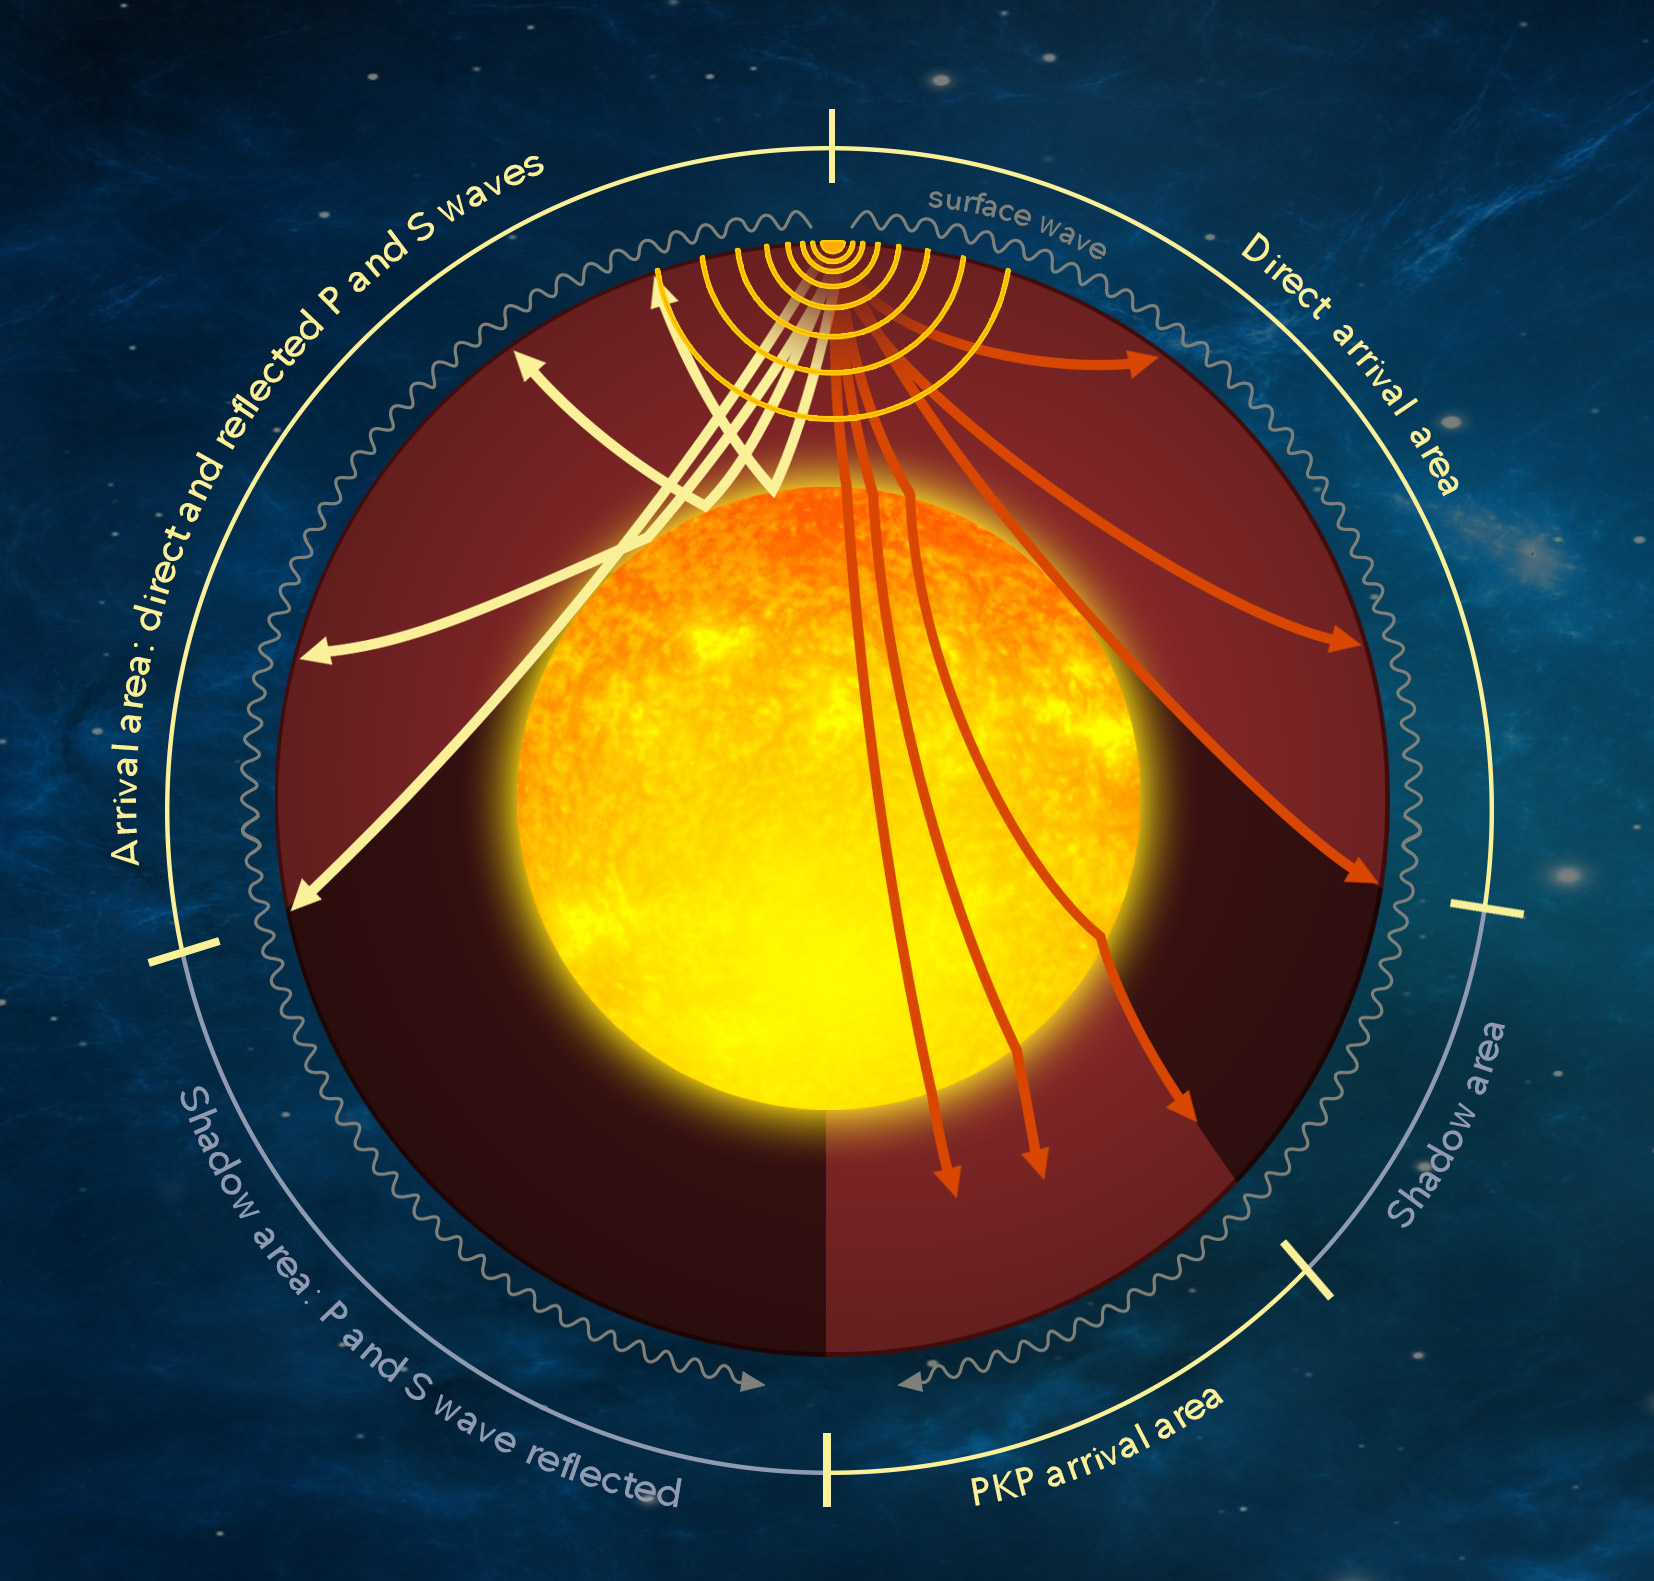
By studying the propagation of P waves and S waves, they found that the P and S waves emitted during an earthquake do not reach seismometers located in a band at a distance between 103 ° and 143 °, measured on the surface of the Earth from the epicentre of the earthquake. Shaded areas appear where the P and S waves are not detected and they mean that there are interfaces or discontinuities where the seismic waves abruptly refract.
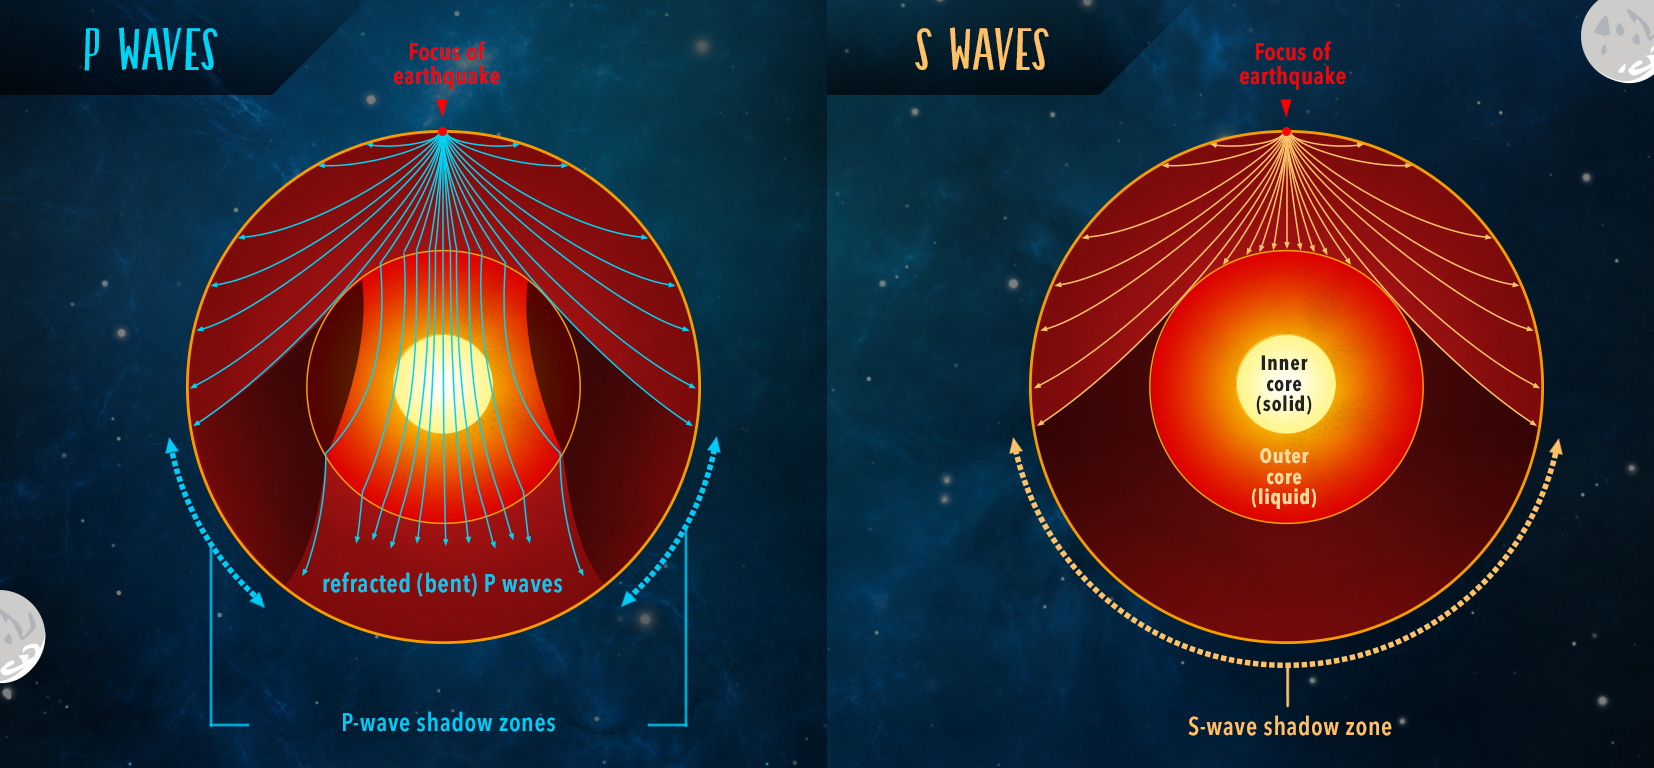
P and S waves propagating through the Earth. (© Arteclick)
Similarly, by studying the travel times of the P and S waves, seismologists have determined that seismic waves travel at different speeds depending on the depth and the geological nature of the layers they cross.
Thus under the continents going to a depth of 35 to 40 km then under the oceans to a depth of 8 km is a boundary called the Moho which separates the crust from the upper mantle of the Earth.
Then between about 100 and 200 km deep, there is a first layer 100 to 200 km deep called the low-velocity zone (LVZ), because the wave speed is greatly slowed down. As seismic waves propagate more slowly in liquids than in solids, we therefore think that the LVZ is a zone where the rock contains small fractions of melted material.
Between 200 and 410 km, the speed of seismic waves in the mantle increases with depth. This increase means that this part of the Earth called the mantle becomes progressively more rigid and denser with depth.
Between 410 and 660 km deep is the transition zone. In this zone the speed of seismic waves always increases with depth.
Beyond this transition zone is the lower mantle where the velocity of the seismic waves increases slowly with depth.
At 2,900 km is the interface between the outer core and the mantle called the Gutenberg Discontinuity. S waves do not propagate in the outer core. The fact that S waves do not pass through the outer core means that the outer core is made of liquid. P-waves are slowed down.
At 5100 km the P-waves have passed through the outer core and are reflected at an interface called the Lehmann Discontinuity. P-waves accelerate as they enter the inner core of the Earth. The S-waves re-appear. The inner core is therefore solid.
In summary, the core is composed of two parts: an outer core made of a liquid iron alloy and an inner core made of a solid iron alloy.
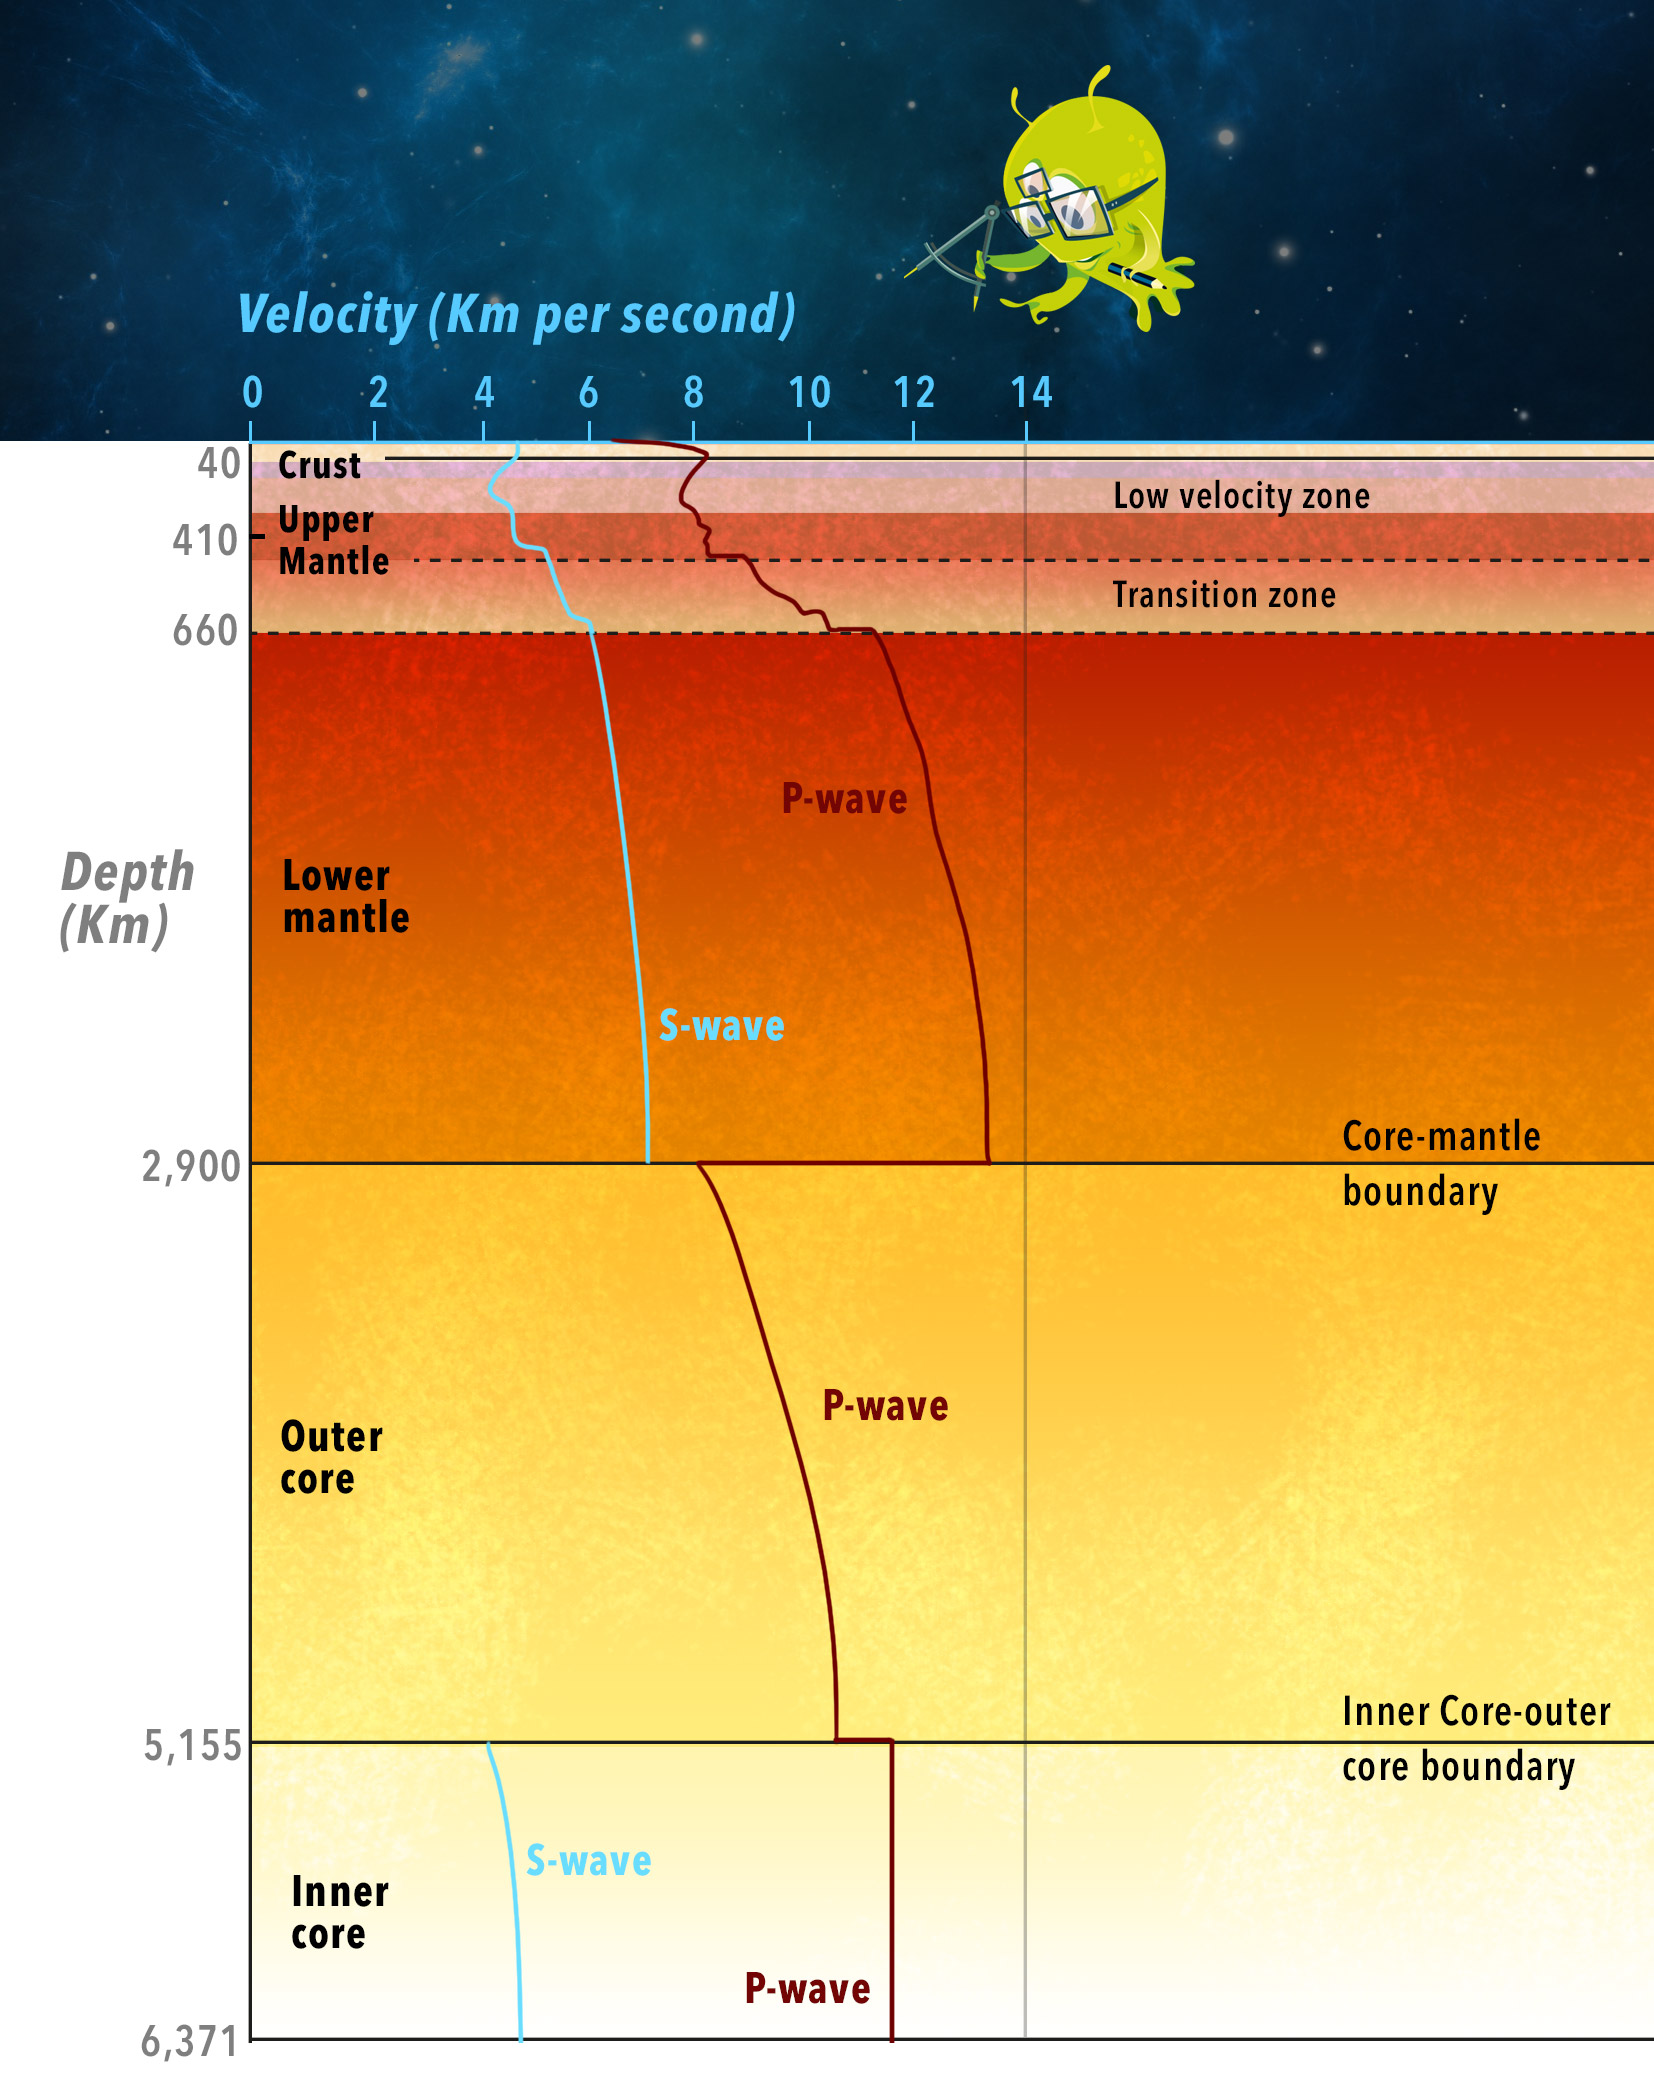
P and S waves propagating through the Earth meeting first the low velocity zone (LVZ) then the transition zone. The P waves are refracted by the interface at the level of the liquid external core then by the interface at the level of the solid internal core. S waves cannot pass through the liquid external core and reappear from the interface of the solid internal core. © Arteclick)
Quiz!
Validate your knowledge!
Magnitude and Intensity

Magnitude measures the energy released at the focus of the earthquake when the fault suddenly breaks.
Magnitude can be calculated mathematically from the amplitude of the ground movements recorded by a seismometer in which case we call it the local magnitude, or it can be calculated from the ground motion duration when we call it the duration magnitude, or from of the total radiated energy, in this case we call it the energy magnitude.
In summary, no seismometer means, no seismogram, and no seismogram means, no magnitude!
Each of these magnitudes scales is logarithmic : an increase of one unit in magnitude corresponds to a 10-fold increase in the amplitude of motion of the ground. In general, the use of a certain type of magnitude is linked to the size of the earthquake: the local and duration magnitudes are suited to the measurement of small earthquakes up to M: 5 or M: 6, after that point only the energy magnitude scale can characterize very large earthquakes beyond M: 8.5.
The more energy an earthquake releases, the higher the magnitude. On the Richter scale an increase in magnitude of 1 corresponds to a multiplication by 30 of the energy and by 10 of the amplitude of the ground movement.
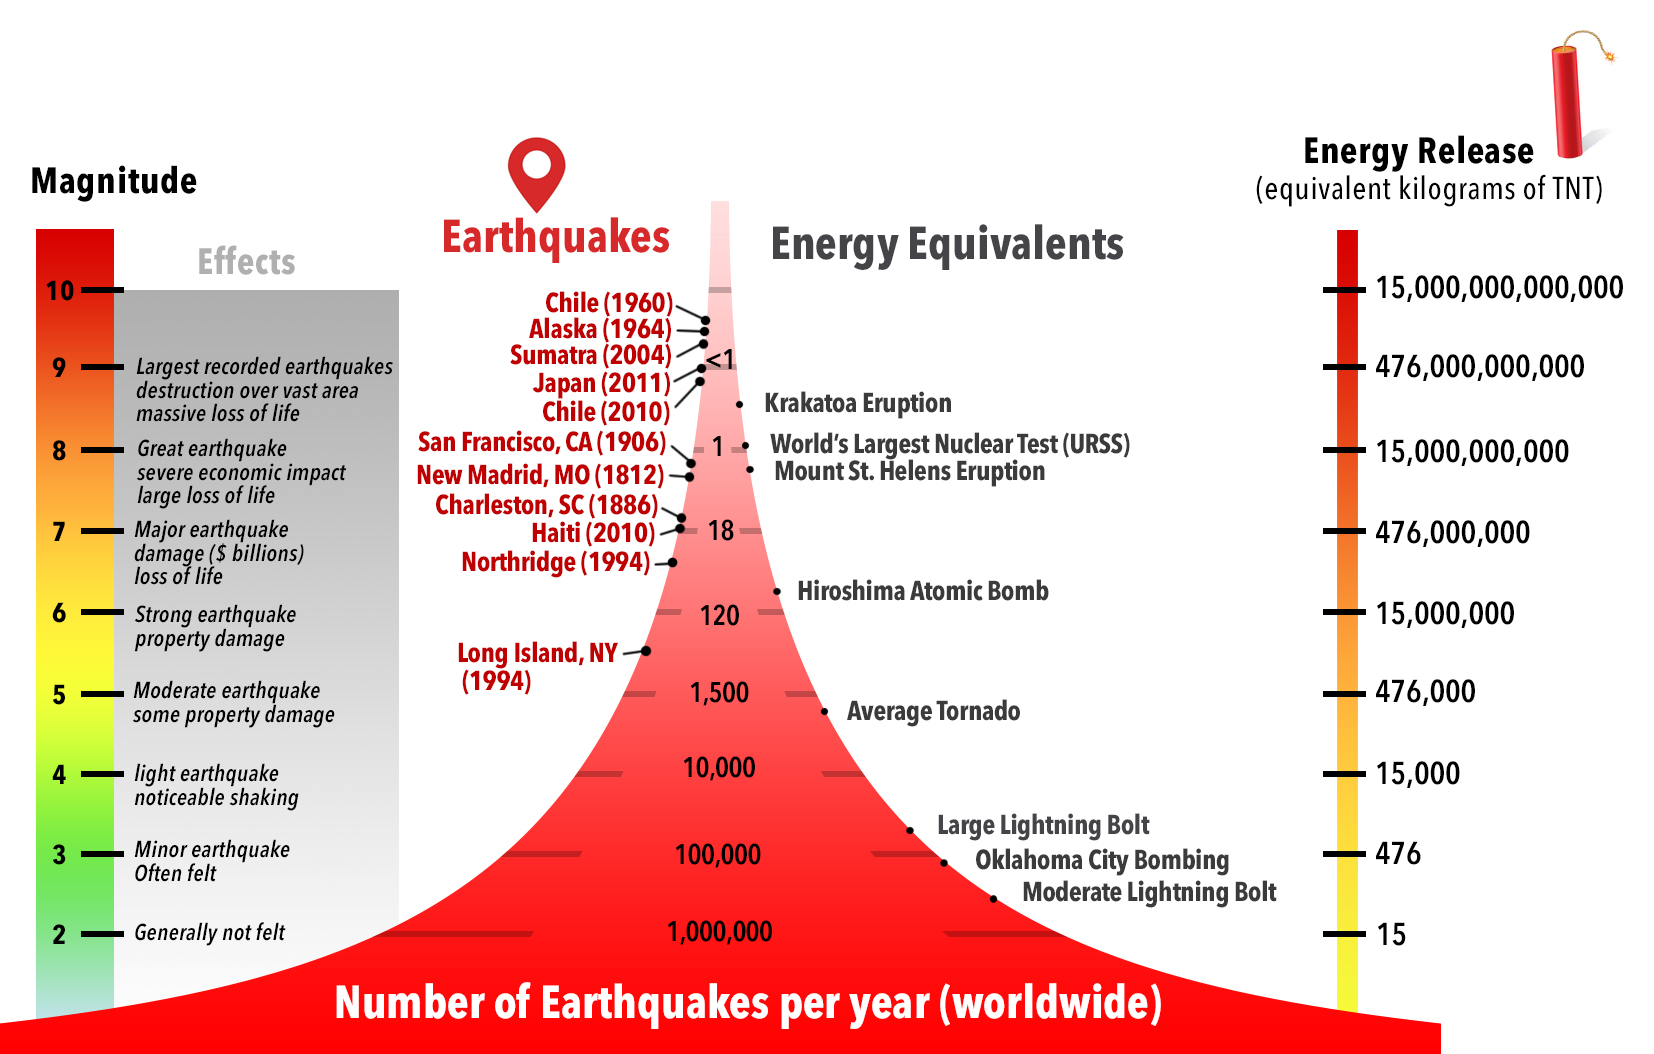
The magnitude of earthquakes, the energy release and the frequency of earthquakes per year. (© IRIS and Arteclick)
For most places on Earth, the rate at which earthquakes of different magnitudes occur also follows a rule of x10, i.e. earthquakes of magnitude 5 generally occur 10 times more often than magnitude 6 earthquakes, etc.
The magnitude of an earthquake is related to the length of fault that breaks during that earthquake, thus the range of magnitudes is limited by the geometry of the borders of tectonic plates. Currently we can envisage a rupture of a few thousand kilometres at most, which would correspond to an earthquake of magnitude 10 approximately.
Earthquakes of the 20th century . (© NOAA NEIC Earthquake Catalog)
Large earthquakes correspond to faults of several hundred kilometres, while small tremors correspond to ruptures of a few centimetres.
The largest earthquake ever recorded had a magnitude of 9.5 and occurred in 1960 in Chile. Magnitudes smaller than zero are also frequently detected. They are sometimes called microseisms. For example the fall of a brick from a height of 1m is equivalent to an earthquake of magnitude -2!
In summary, 1 earthquake corresponds to 1 magnitude
Intensity describes the effects of an earthquake based on the extent of the damage in a given place and on the subjective perception of the observers.
The effects of earthquakes are described using EMS98 (the European Macroseismic Scale). No instruments are required to determine the intensity of an earthquake. It is estimated from the observation of the damage, the amount of shaking felt by people, and the geological nature of the soil. The intensity describes in particular the damage to buildings.
To summarize, to 1 earthquake we can assign several intensity values
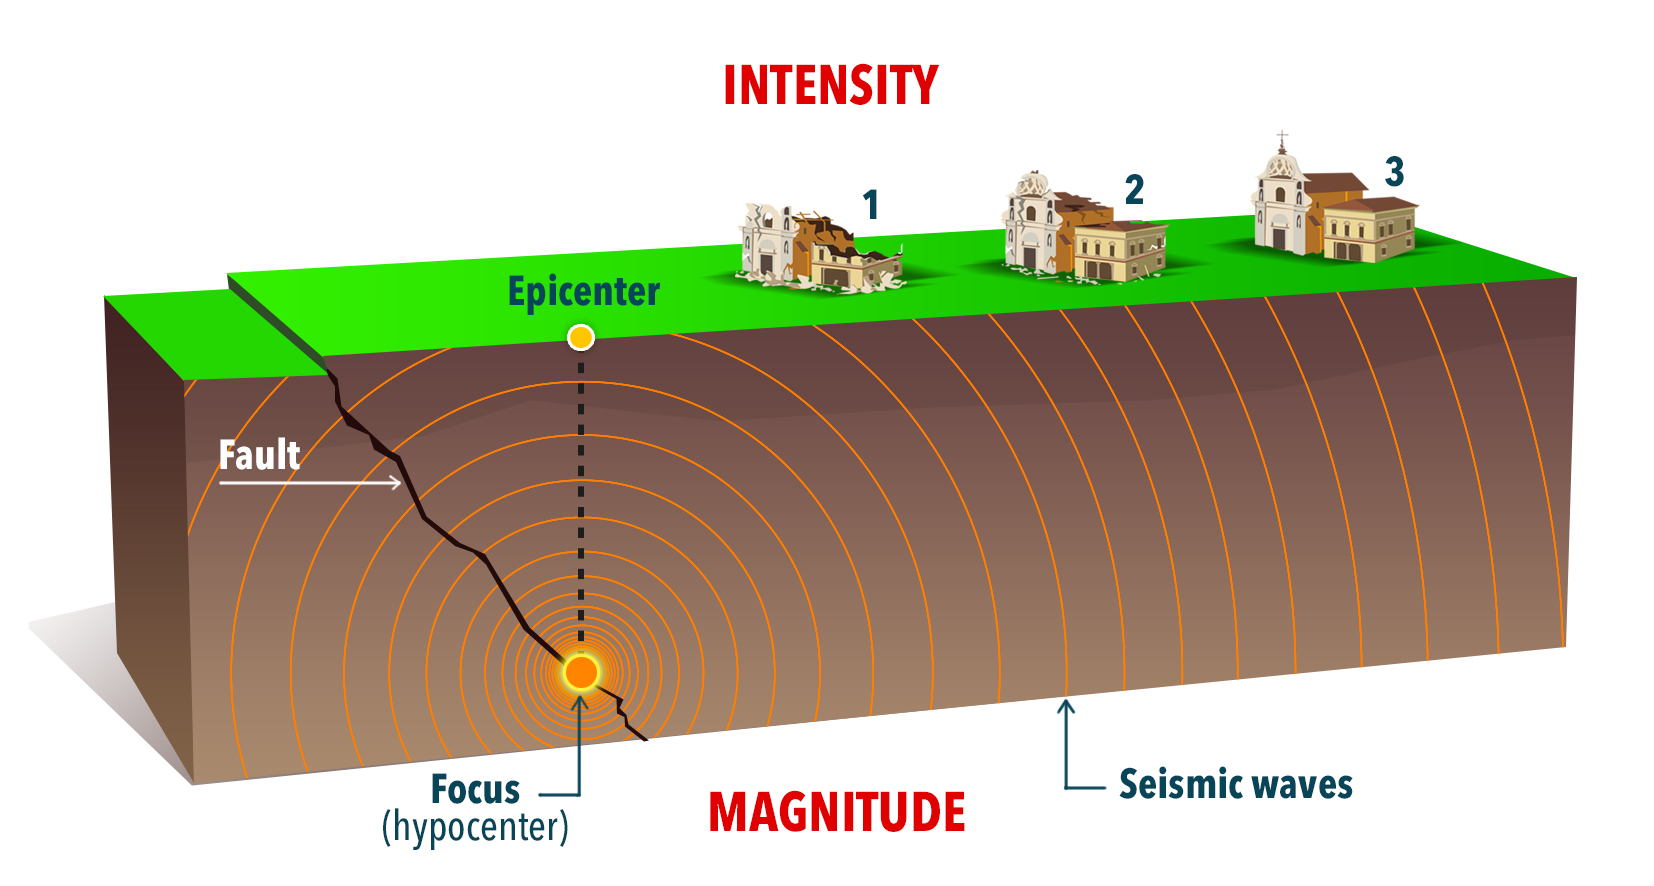
The focus, the epicentre, 1 magnitude and 3 intensities (1,2,3) to characterize this earthquake. Earthquakes can be felt from a magnitude around M2.5. From magnitude M 4.5 to M5.5, damage to buildings is observed but, in some cases, greater damage can be observed. The impact of an earthquake depends very strongly on the distance to the hypocentre and the epicentre, the local geology and the type of construction of a building. (© BRGM)
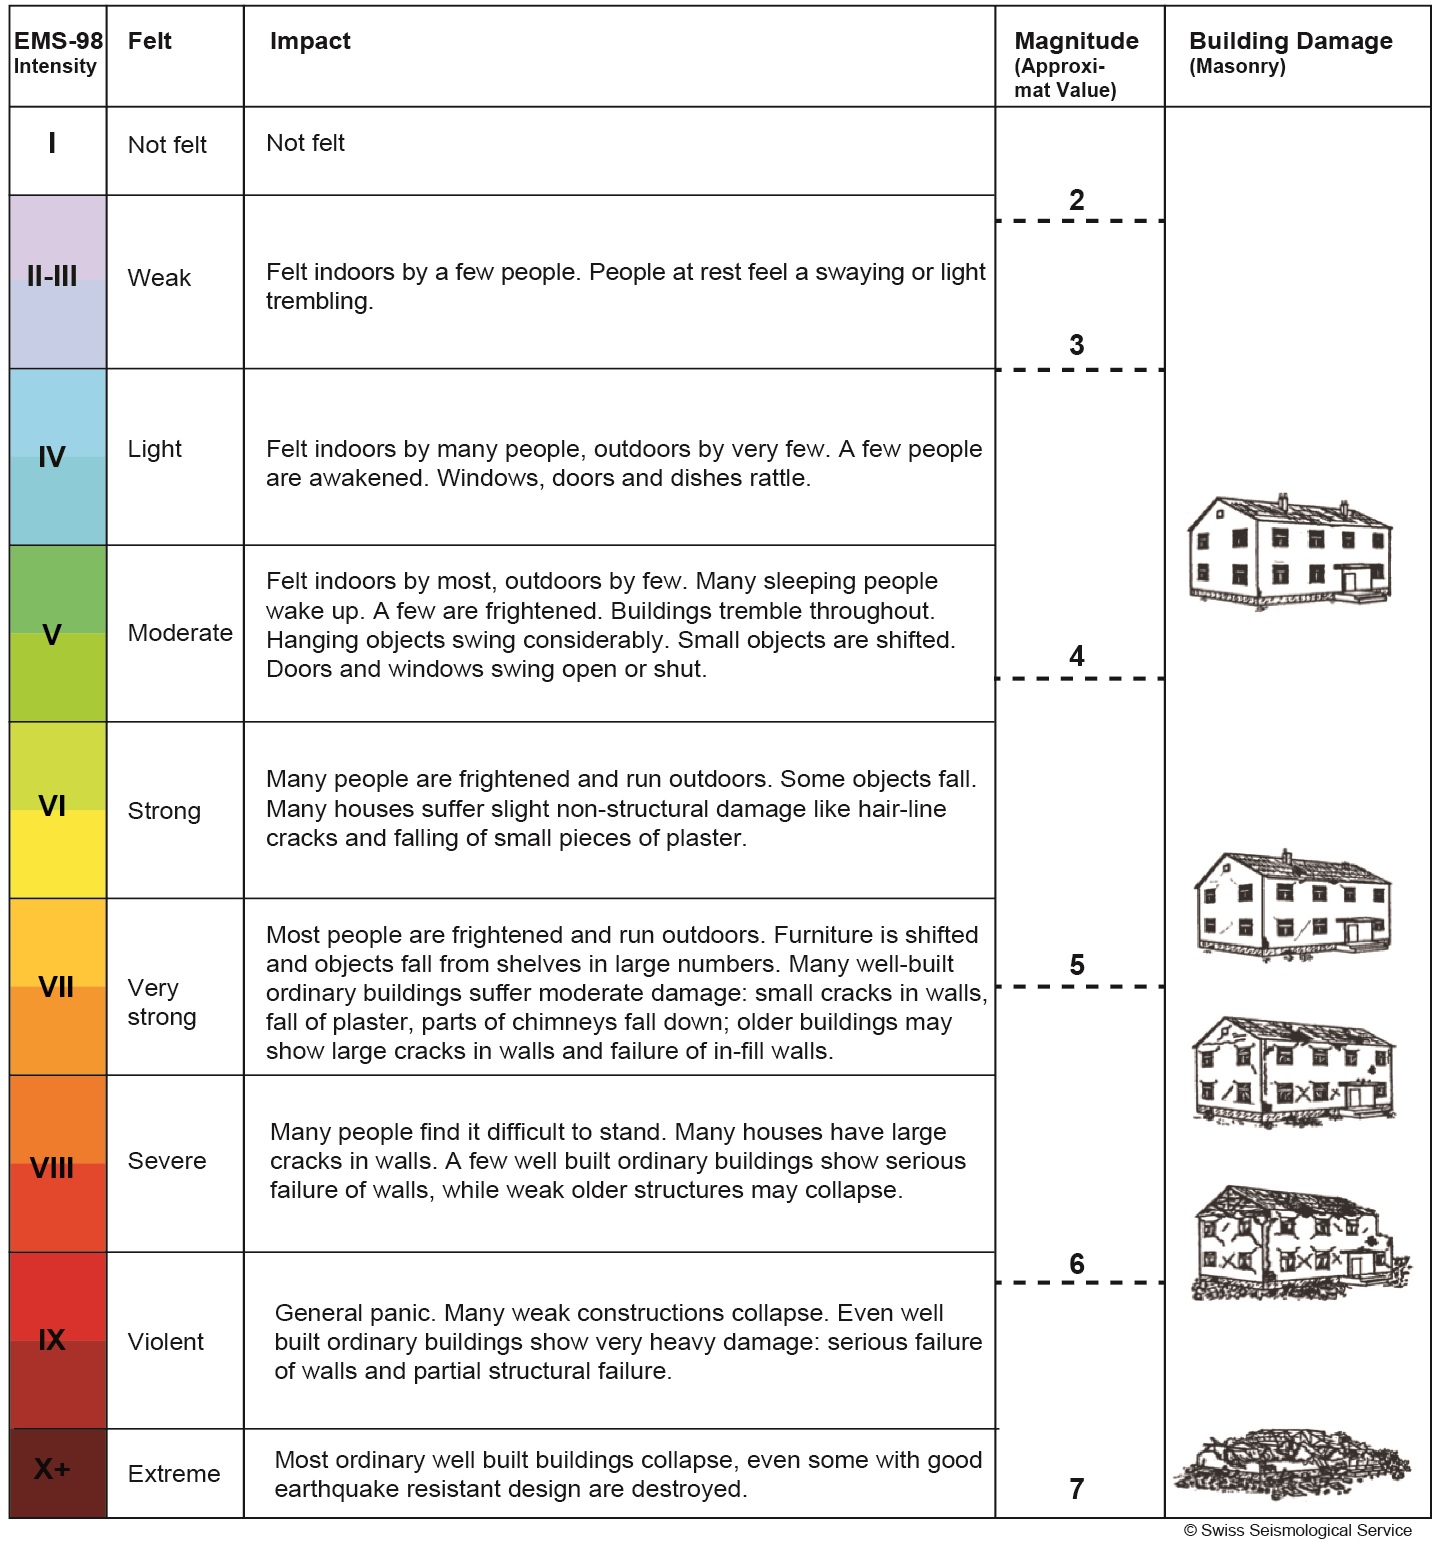
Impacts on buildings of an earthquake as a function of intensity (© Swiss Seismological Service)
Earthquake intensities are a useful means of comparing modern-day instrumental earthquakes with historical events for which we have only written descriptions. After an earthquake, scientists often ask people to describe the shaking they experienced and collect the information to create intensity maps.
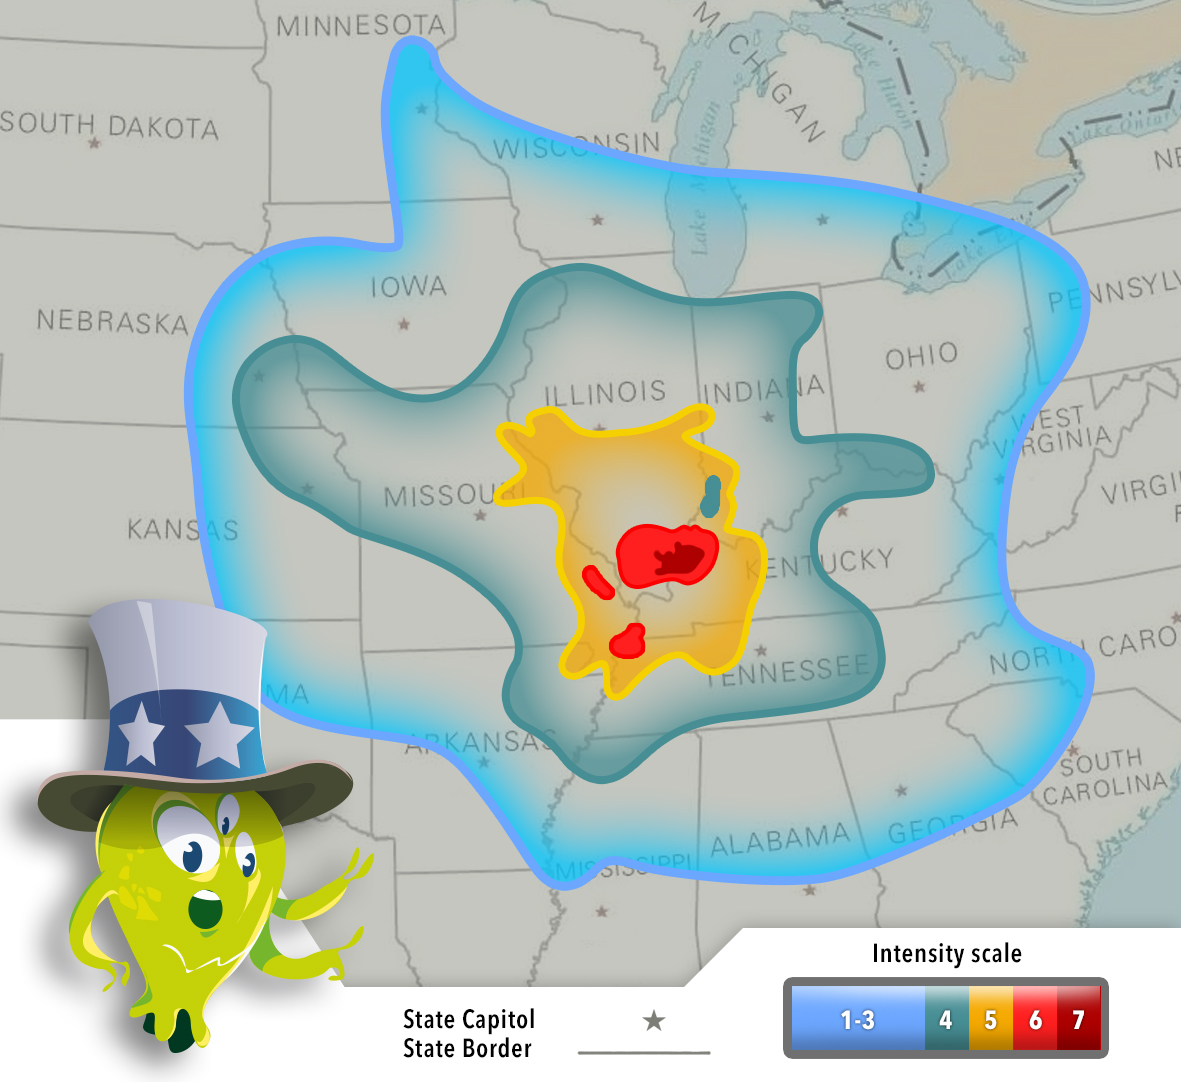
The ShakeMaps provide a map of ground movement and earthquake shake intensity. (© Arteclick)
Quiz!
Validate your knowledge!
Previous adventure
End of mission

We would like to thank :
Paul Denton
Denton Seismo Ltd UK,www.dentonseismo.co.uk
Scientific Interaction and English translation
Laurence laffargue-Rieder
German translation
Philippe Labrot
IPGP, Institut de Physique du Globe de Paris, France
Scientific Interaction
Philippe Lognonné
IPGP, Institut de Physique du Globe de Paris, France
Scientific Interaction
Philippe Laudet
CNES, National Centre for Space Studies, France
Scientific Interaction
William Bruce Banerdt
JPL, Jet Propulsion Laboratory, Pasadena, CA, USA
Scientific Interaction
Credits : IPGP, NASA, JPL, CNES, CEA, ETH Zurich and University of Zürich